
Some of Our Sources
- Just Creative
- Pearsonified
- Six Revisions
- Naldz Graphics
- CSS Globe
- Line 25
- Spyre Studios
- Freelance Switch
- Android Dissected
- TechPowerUp
Help Webnuz
Referal links:
Building dashboards over a semantic layer with Superset and Cube
What can be more troubling and horrifying for an Apache Superset user than a scarlet error message revealing that the underlying dataset is broken and charts arent going to provide any insights anytime soon? Sigh.

Indeed, modern data pipelines consist of many movingand sometimes fragileparts. Superset, the Swiss knife of data exploration and visualization, deserves rock-solid data sources but in the real world, upstream changes are inevitable. They may be connected to immature technology in the data stack as well as ever-changing business requirements and balkanized ownership of data pipelines.
Within minutes, you can find conversations on Supersets Slack or GitHub revolving around identifying broken dashboards and finding ways to reduce the impact on users:

Im happy to share that a solution exists. You can use Cube together with Superset and define your datasets over a data modeling layer (or a semantic layer) rather than raw data:

In this tutorial, well explore how Cube, a headless BI platform, can be used together with Superset to build reliable and robust data visualizations on top of a semantic layer. Youll learn techniques to prevent your dashboards from breakingand tools that would notify you about incompatible upstream changes in data before your users even notice.
What is Headless BI?
Cubeis an open-sourceheadless BI platformwith nearly 13,000 stars onGitHubto date. It can be broken down into four layers that are complemented by a head or multiple heads like Apache Superset, another BI tool, or a front-end application with embedded analytics. Here are the layers:
- Data modeling. Contains consistent metrics definitions and provides a view of the upstream data in terms of measures and dimensions. Makes data semantic.
- Access control. Safeguards data access and enables row-level security, role-based access, and multitenancy. Makes data secure.
- Caching. Accelerates data access and makes end-user applications responsive and rewarding to use. Makes apps fast.
- APIs. Exposes data to downstream applications via REST, GraphQL, or SQL API. Makes data accessible.
You can configure Cube to connect to any database, declaratively define your metrics, and instantly get an API that you can use with Superset or many other BI tools.
In case of any upstream change (be it a renamed column, a dropped table, or a migrated data source), you can update the data model in Cube and keep hundreds of charts and dozens of dashboards in your Superset installation intact. Sounds refreshing, huh?
Lets try Superset with Cube and see how it works!
Running Cube with Superset
To keep things simple and save time, we'll run both Cube and Superset in fully managed environments: Cube Cloud and Preset Cloud. Note that both tools have generous free tiers, e.g., you can use Preset Cloud forever for free on the Starter plan. (If you'd like to run Cube or Superset locally with Docker, please see Cube and Supeset instructions, respectively.)
Running Cube. First, please proceed to Cube Clouds sign up page and fill in your details. Note that Cube Cloud supports signing up with your GitHub account. Within a few seconds you will be taken to your account where you can create your first Cube deployment:

Proceed with providing a name for your deployment, selecting a cloud provider and a region:

At the next step, choose Create to start a new Cube project from scratch. Then, pick Postgres to proceed to the screen where you can enter the following credentials:
Hostname: demo-db-examples.cube.devPort: 5432Database: ecom_supersetUsername: cubePassword: 12345
Cube will connect to a publicly available Postgres database that I've already set up.
The last part of configuration is thedata schemawhich declaratively describes the metrics we'll be putting on the dashboard. Actually, Cube can generate it for us! Pick the top-level public database from the list and select only the orders table:

In a while, your Cube deployment will be up and running:

Defining metrics. Please navigate to the "Schema" tab. You will see the Orders.js file under the "schema" folder. Lets review it.

This file defines the metrics within the "Orders" cube. It is different from the one in Cube Cloud, but we'll take care of that later.
cube(`Orders`, { sql: `SELECT * FROM public.orders`, dimensions: { id: { sql: `id`, type: `number`, primaryKey: true }, // 'processing', 'shipped', or 'completed' status: { sql: `status`, type: `string` }, createdAt: { sql: `created_at`, type: `time` }, shippedAt: { sql: `shipped_at`, type: `time` }, completedAt: { sql: `completed_at`, type: `time` }, // Calculated, uses SQL functions and column references daysBeforeShipped: { sql: `EXTRACT(DAYS FROM (shipped_at - created_at))`, type: `number` }, // Calculated, uses SQL functions and column references daysBeforeCompleted: { sql: `EXTRACT(DAYS FROM (completed_at - created_at))`, type: `number` } }, measures: { count: { type: `count` }, // Calculated, uses a dimension reference avgDaysBeforeShipped: { sql: `${daysBeforeShipped}`, type: `avg` }, // Calculated, uses a dimension reference avgDaysBeforeCompleted: { sql: `${daysBeforeCompleted}`, type: `avg` } },});Key learnings here:
- the cube is a logical, domain-level entity that includes measures and dimensions
- using the
sqlstatement, this cube is defined over the entirepublic.line_itemstable; actually, cubes can be defined over arbitrary SQL statements that select data - dimensions (qualitative data features) are defined over textual, temporal, or numeric columns in the dataset
- measures (quantitative data features) are defined as aggregations (e.g.,
count,avg, etc.) over columns or dimensions in the dataset - you can define complex measures and dimensions with custom
sqlstatements or references to other measures and dimensions
Development mode. Now, let's update the schema file in Cube Cloud to match the contents above. First, click Enter Development Mode to unlock the schema files for editing. This essentially creates a "fork" of the Cube API that tracks your changes in the data schema.
Navigate to Orders.js and replace its contents with the code above. Then, save your changes by clicking Save All to apply the changes to the development version of your API. You can apply as many changes as you wish, but we're done for now. Click Commit & Push to merge your changes back to the main branch:

On the "Overview" tab you will see your changes deployed:

Now you can explore the metrics on the "Playground" tab:

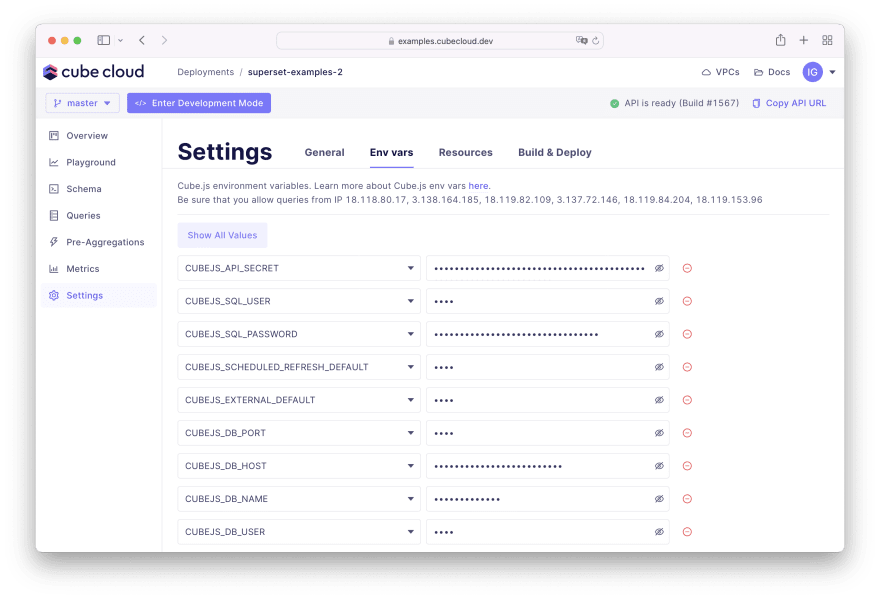
When youre ready, head over to the Overview tab, click Deploy SQL API and use the How to connect your BI tool link shortly thereafter.

You will see the credentials that well use to connect the metrics store that weve built with Cube to Superset in a few moments. How?
Running Superset. Please proceed to Presets sign up page and fill in your details. Note that Preset Cloud supports signing up with your Google account. Within a few seconds you will be taken to your account with a readily available workspace:

Switching to that workspace will reveal a few example dashboards that you can review later.

Connect Superset to Cube. Navigate to Data / Databases via the top menu, click + Database, select MySQL, and fill in the credentials from your Cube Cloud instance or use the credentials below:
- Host:
green-yak.sql.aws-us-east-2.cubecloudapp.dev - Port:
3306 - Database name:
db - Username:
cube@green-yak - Password:
82e26064349b19c340f8b074dfcee4af - Display name:
Cube Cloud(it's important)

You can press Connect now.
Define the datasets. Navigate to Data / Datasets via the top menu, click + Dataset, and fill in the following credentials:
- Database:
Cube Cloud(the one we've just created) - Schema:
db - See table schema:
Orders

You can press Add now. Then, hover over the newly added dataset and click the pencil icon in the Actions column. Well need to make sure Superset recognizes a couple of measures. First, navigate to the Columns tab and deselect Is dimension for avgDaysBeforeShipped and avgDaysBeforeCompleted:

Then, switch to the Metrics tab and add these two:
- Metric:
avgDaysBeforeShipped; SQL expression:AVG(avgDaysBeforeShipped) - Metric:
avgDaysBeforeCompleted; SQL expression:AVG(avgDaysBeforeCompleted)

Press Save in the end. Whew, were all set! Now, lets display the data on a chart.
Building a dashboard. Navigate to Charts via the top menu, click + Chart, and use the following configuration for your first chart:
- Choose a dataset:
Orders(the one we've just created) - Choose a chart type:
Table
When youre done, click Create new chart. Feel free to experiment with parameters on this screen and click Run Query to explore the data. To proceed, please set up a chart like this:
- Visualization type:
Table - Time column:
createdAt - Time grain: any value
- Group by:
status - Metrics:
COUNT(*),avgDaysBeforeShipped,avgDaysBeforeCompleted
Heres the data table youll get:

You can click Save to give your chart a name and add it to a new dashboard:

Looks good? We now have a dashboard in Superset displaying a chart that queries data from Cube using the measures and dimensions in Cubes data model.

Cube translates queries coming from Superset into queries to the upstream data source. What would happen if anything happens upstream? Heres when all the fun starts!
Mishap 1: Column renamed or removed
Lets say you (or your users) open the dashboard one day and behold this orange introduction into a few less-than-productive work hours. Apparently, the status column is not present in the data source anymore and a few uninformed business decisions might be made (or put on hold) until your team debugs the circumstances of the removal.
What can be done to mitigate this? Well, lets reproduce this situation first. You can do so by navigating to Cube Cloud, switching to the Development Mode, and editing the Orders.js file. Just change the SQL expression to reference orders_wo_status table that, obviously enough, has exactly the same data as the orders table but the status column is removed:

Then, you can save and commit the changes:

After the Cube Cloud deployment is redeployed in a few moments, you can refresh your dashboard in Superset to switch it into the annoying orange state. (If the dashboard doesnt break, try pressing the button with three dots in the top right corner and requesting the dashboard to refresh.)
Unbreaking the dashboard, a simple way. Lets say that the status column was removed because its redundant: its values can be calculated using the values in created_at, shipped_at, and completed_at columns. Then, how to fix the dashboard after the column removal?
One way to do so is to edit the dataset in Superset. You can delete the missing column and add it back as a calculated one using Supersets semantic layer. (If youd like to dig deeper, check out this post in Presets blog.)
However, there are a few downsides: first, this calculated column wouldnt be visible in Supersets SQL Editor where you might run SQL queries to perform data exploration; second, the calculation wouldnt propagate upstream. If Superset is not the only tool you use (or would ever use) to explore your data, its better to apply the fix upstream rather than make duplicated fixes all over different tools.
Unbreaking the dashboard, a better way. An alternative way is to replace the status column with a calculation in Cubes data model. Then, Superset and all other tools would work as if that column was never removed and your dashboard never broke.
You can go back to Cube Cloud, switch to the Development Mode, and edit the Orders.js file once again. Lets replace the status dimension with the following code snippet:
status: { case: { when: [ { sql: `completed_at IS NOT NULL`, label: `completed` }, { sql: `shipped_at IS NOT NULL`, label: `shipped` }, ], else: { label: `processing` }, }, type: `string`, },You can save and deploy your changes. Note that were using a case dimension that provides some syntactic sugar over a regular CASE... WHEN... THEN... ELSE... END SQL statement and provides the ability to reference other dimensions:
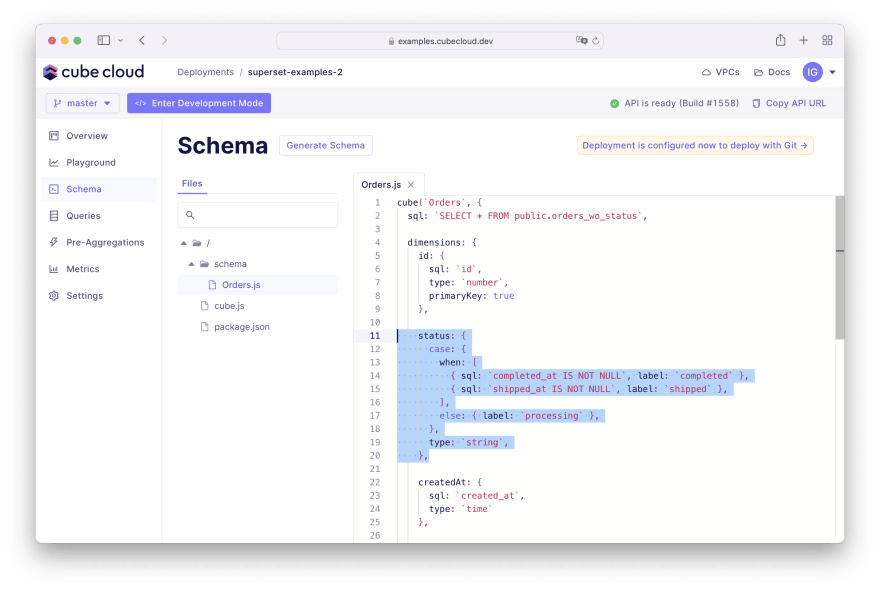
Congratulations! Without any changes in Superset, your dashboard is back to a healthy state:
Moreover, if you ever need to introduce a more complex calculation to any dimension or measure, you can always do that in Cube Cloud and still wont need to change anything in tools that consume data, including Superset.
Mishap 2: Table altered or removed
Lets say you (or your users) open the dashboard and see this unfortunate orange notification once again. Apparently, the shipped_at column doesnt exist:

The reason is that developers of the upstream system decided to implement the event sourcing design pattern, meaning that theres no orders table anymore. Instead, theres the orders_events table that, obviously enough, has exactly the same data but completely reshaped as a stream of events related to orders status changes. In that table, every row represents only partial information about an order and the timestamp column replaced previously existing created_at, shipped_at, and completed_at columns. Heres the DDL statement:
create table orders_events( order_id integer, user_id integer, status text, timestamp timestamp);Wanna try that yourself? You can do so by navigating to Cube Cloud, switching to the Development Mode, and editing the Orders.js file. Just change the SQL expression to reference orders_events table:

After the Cube Cloud deployment is redeployed, you can refresh your dashboard in Superset to switch it into the annoying orange state. (If the dashboard doesnt break, try pressing the button with three dots in the top right corner and requesting the dashboard to refresh.)
Unbreaking the dashboard, a complex way. One way to do so is to introduce a data transformation tool to your data pipeline (assuming you dont use one) that would transform the data back into the desired state.
However, there are a few downsides: first, this is more like a month-long project than a quick fix to the data pipeline; second, it might bring unnecessary and unwanted complexity to your technology stack. (Note that if you actually use dbt or dbt Metrics, Cube has an integration.)
Unbreaking the dashboard, a better way. An alternative way is to update Cubes data model to transform data back to the desired state. Then, Superset and all other tools would work as if the table was never removed and your dashboard never broke.
You can go back to Cube Cloud, switch to the Development Mode, and edit the Orders.js file once again. Lets replace the source code of the file with the following code snippet:
cube(`Orders`, { sql: ` WITH bareOrders AS ( SELECT order_id AS id, user_id FROM public.orders_events GROUP BY order_id, user_id ), orders AS ( SELECT bareOrders.*, (CASE WHEN completed.timestamp IS NOT NULL THEN completed.status ELSE (CASE WHEN shipped.timestamp IS NOT NULL THEN shipped.status ELSE processing.status END) END) AS status, COALESCE(processing.timestamp, shipped.timestamp, completed.timestamp) AS created_at, COALESCE(shipped.timestamp, completed.timestamp) AS shipped_at, completed.timestamp AS completed_at FROM bareOrders LEFT JOIN public.orders_events AS processing ON bareOrders.id = processing.order_id AND processing.status = 'processing' LEFT JOIN public.orders_events AS shipped ON bareOrders.id = shipped.order_id AND shipped.status = 'shipped' LEFT JOIN public.orders_events AS completed ON bareOrders.id = completed.order_id AND completed.status = 'completed' ) SELECT * FROM orders `, dimensions: { id: { sql: `id`, type: `number`, primaryKey: true }, // 'processing', 'shipped', or 'completed' status: { sql: `status`, type: `string` }, createdAt: { sql: `created_at`, type: `time` }, shippedAt: { sql: `shipped_at`, type: `time` }, completedAt: { sql: `completed_at`, type: `time` }, // Calculated, uses SQL functions and column references daysBeforeShipped: { sql: `EXTRACT(DAYS FROM (shipped_at - created_at))`, type: `number` }, // Calculated, uses SQL functions and column references daysBeforeCompleted: { sql: `EXTRACT(DAYS FROM (completed_at - created_at))`, type: `number` } }, measures: { count: { type: `count` }, // Calculated, uses a dimension reference avgDaysBeforeShipped: { sql: `${daysBeforeShipped}`, type: `avg` }, // Calculated, uses a dimension reference avgDaysBeforeCompleted: { sql: `${daysBeforeCompleted}`, type: `avg` } },});As you can see, Cubes data model is flexible enough to allow cubes to be defined over arbitrary SQL expressions that can contain common-table expressions (CTE), unions, joins, etc. The rule of thumb for structuring the data model in Cube is that cubes, measures, and dimensions should make sense at the logical, domain level. And if your data is stored differently, you should feel free to reshape it in Cubes data model.
You can save and deploy your updates in Cube Cloud. Again, without any changes in Superset, your dashboard is back to a healthy state:
Mishap 3: Data source changed
Lets say something rare yet impactful happened: the team decided to upgrade the data pipeline, introduce new tools, etc. Eventually, the data will move from Postgres to BigQuery, new ETL and data transformation tools will be used. What can we do to prevent the dashboards from breaking or avoid rebuilding the dashboards in Superset?

Since weve already connected Superset to Cube, we can sort things out on Cubes side. Just like Superset, Cube supports numerous data sources and a Cube instance can use any subset of these data sources at the same time.
Unbreaking the dashboard. Heres how you can configure Cube to connect to Postgres and BigQuery and update the data model so the orders data is read from BigQuery.
In Cube Cloud, youll need to switch to the Development Mode. First, lets update Orders.js to match the following snippet. Check out the new dataSource option and the updated definitions for daysBeforeShipped and daysBeforeCompleted that use BigQuery-specific TIMESTAMP_DIFF function instead of Postgres-specific EXTRACT function:
cube(`Orders`, { dataSource: 'bigquery', sql: `SELECT * FROM superset_examples_2.orders`, dimensions: { id: { sql: `id`, type: `number`, primaryKey: true }, // 'processing', 'shipped', or 'completed' status: { sql: `status`, type: `string` }, createdAt: { sql: `created_at`, type: `time` }, shippedAt: { sql: `shipped_at`, type: `time` }, completedAt: { sql: `completed_at`, type: `time` }, // Calculated, uses SQL functions and column references daysBeforeShipped: { sql: `TIMESTAMP_DIFF(shipped_at, created_at, DAY)`, type: `number` }, // Calculated, uses SQL functions and column references daysBeforeCompleted: { sql: `TIMESTAMP_DIFF(completed_at, created_at, DAY)`, type: `number` } }, measures: { count: { type: `count` }, // Calculated, uses a dimension reference avgDaysBeforeShipped: { sql: `${daysBeforeShipped}`, type: `avg` }, // Calculated, uses a dimension reference avgDaysBeforeCompleted: { sql: `${daysBeforeCompleted}`, type: `avg` } }});Next, lets edit the cube.js file to match the following snippet:
// Cube.js configuration options: https://cube.dev/docs/configconst PostgresDriver = require('@cubejs-backend/postgres-driver');const BigQueryDriver = require('@cubejs-backend/bigquery-driver');module.exports = { contextToAppId: ({ dataSource }) => dataSource, dbType: ({ dataSource }) => { return dataSource === 'bigquery' ? 'bigquery' : 'postgres'; }, driverFactory: ({ dataSource }) => { return dataSource === 'bigquery' ? new BigQueryDriver() : new PostgresDriver(); }};Note the driverFactory extension point where the database selection happens: for cubes with the bigquery data source, BigQuery will be used, and Postgres will be used otherwise. Also note that we dont need to specify the credentials for Postgres and BigQuery explicitly because they are securely stored in Cube Clouds settings. Not sharing BigQuery credentials with you because who would do that?
With these changes in Cube Cloud and without any changes in Superset, your dashboard will be back to a healthy state:
Oh, and theres one more thing! Cube also supports data federation meaning that you can join data from different data sources, e.g., from Snowflake and Athena, if needed. To implement that, you can use pre-aggregations and declaratively set up a rollupJoin pre-aggregation that would seamlessly join data from multiple data sources under the hood.
Cherry on top: Alerts
In all examples above it was either us or our users who were to discover the broken dashboard. In production scenarios, that definitely should not happen. What can we do to get a notification before users see a broken dashboard?
Since weve decided to run Cube in Cube Cloud, we can use the Alerts feature there (not to be confused with Supersets Alerts and Reports feature which is a convenient way to send reports with dashboard data to email). Alert conditions are checked every minute. If an alert is triggered, configured recipients will get email notifications.
You can set up alerts for events like database unavailability or pre-aggregations build errors. In production scenarios, Cube is always used with pre-aggregations. It means that if a database becomes unavailable or the data within the database changes in a way that Cube cant rebuild a pre-aggregation, you will instantly receive a notification.
Configuring alerts. You can go to Cube Cloud, click on your avatar in the top right corner, click Alerts to get to the Alerts page, then click New Alert to set up one.

Lets go with almost default settings:
- Event type:
Pre-aggregation build failure - Deployments:
All - Send alerts to:
All users on this account
You can click Add now.

Testing alerts. The simplest way to test this newly setup alert is to configure pre-aggregations and then break the data model, e.g., change the table name to a wrong one.
You can go back to Cube Cloud, switch to the Development Mode, and edit the Orders.js file once again. Lets update the very beginning of the file in this fashion:
cube(`Orders`, { dataSource: 'bigquery', // An utterly wrong table name sql: `SELECT * FROM superset_is_not_great`, // A simple pre-aggregation scheduled to refresh every hour preAggregations: { main: { refreshKey: { every: '1 hour' }, dimensions: [ status ] } },// Dimensions and measures go belowAfter you deploy your changes, Cube Cloud would try to build the pre-aggregation, it probably wouldnt find the table with this wicked name and an email notification would hit your inbox:

If you dont have thousands of active Supserset users, chances are that youll know about a broken dashboard way ahead of your users. (Supersets built-in caching mechanism could also help serve unbroken dashboards to users for some time.)
Wrapping up
Thanks for following this tutorial. My sincere hope is that now you have a much better understanding of these topics:
- How Headless BI tools (and Cube in particular) can be helpful to build a think semantic layer and manage the data model upstream of Superset.
- How Cube can help make your Superset dashboards robust and unbreakableand let you know if anything breaks in advance.
Please don't hesitate to like and bookmark this post, write a comment, and give a star toCube and Superseton GitHub. I hope these tools would be a part of your toolkit from now on.
Good luck and have fun!
Original Link: https://dev.to/cubejs/building-dashboards-over-a-semantic-layer-with-superset-and-cube-57ck
Dev To
More About this Source Visit Dev To