
An Interest In:
Web News this Week
- April 23, 2024
- April 22, 2024
- April 21, 2024
- April 20, 2024
- April 19, 2024
- April 18, 2024
- April 17, 2024
Some of Our Sources
- Technology Review
- Web Designer Wall
- Smashing Apps
- Creative Curio
- Noupe
- CSS Globe
- Specky Boy
- Freelance Switch
- Design Modo
- Android Dissected
Help Webnuz
Referal links:
Designing the Analytics patterns using a Lake House approach on AWS
Many organizations are moving all their data from various silos into a single location, often called a data lake, to perform analytics and ML. These same companies also store data in purpose-built data stores for the performance, scale, and cost advantages they provide for specific use cases.
Examples of such data stores include data warehouses (to get quick results for complex queries on structured data) and technologies like Elasticsearch (to quickly search and analyze log data to monitor the health of production systems). A one-size-fits-all approach to data analytics no longer works, because it inevitably leads to compromises.
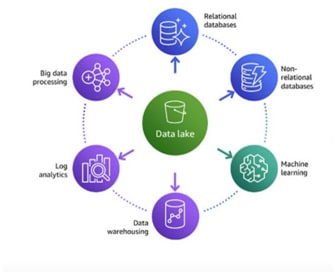
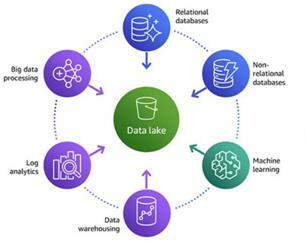
Lake House architecture on AWS provides a strategic vision of how multiple AWS data and analytics services can be combined into a multi-purpose data processing and analytics environment. There are the three analytics patterns you can derive insights from by using a Lake House approach on AWS:
- Inside-out data movement
- Outside-in data movement
- Data movement around the perimeter
Derive insights with inside-out data movement
- To get the most from your data lakes and these purpose-built stores, you need to move data between these systems easily. For example, clickstream data from web applications can be collected directly in a data lake and a portion of that data can bemoved out to a data warehouse for daily reporting. We think of this concept as insideout data movement.
-> Derive real time event-based visualization insights from your Lake house with Amazon Redshift and Amazon QuickSight
Customers often want to analyze their data visually as soon as data is ingested into their data lake, to make decisions with speed and agility for downstream business value.
The following diagram illustrates the Lake House inside-out data movement with Amazon Redshift and Amazon QuickSight to perform data visualization insights.

Derive real time event-based visualization insights from your Lake House with Amazon Redshift and Amazon QuickSight
- The steps that data follows through the architecture are as follows:
- Data ingestion A new data file is uploaded in Amazon S3. An S3 event triggers an AWS Lambda function.
- Event trigger Lambda triggers an AWS Glue workflow to start processing the file. Lambda updates Glue Data Catalog with metadata changes.
- Data processing Load transformed data into target data stores like S3 and Amazon Redshift. AWS Glue jobs push logs and notifications to Amazon CloudWatch. CloudWatch triggers a Lambda function upon AWS Glue job completion.
- Data analytics Analyze the data in Amazon Redshift and the data lake (S3). Lambda calls the QuickSight ingestion API to refresh the SPICE dataset.
- Data visualizations New data is reflected in QuickSight visuals. QuickSight can create a data set by combining data in Amazon Redshift and Athena. Output is stored in SPICE for fast analytics.
-> Derive persona-centric insights from your Lake House with AWS Glue DataBrew, Amazon Athena, Amazon Redshift, and Amazon QuickSight
Many organizations want to get insights from exponentially growing data volumes to help them make decisions with speed and agility.
They need to embrace data gravity by using both a central data lake, and a ring of purpose-built data services and data
warehouses based on persona or job function.The following diagram illustrates the Lake House inside-out data movement with AWS Glue DataBrew, Amazon Athena, Amazon Redshift, and Amazon QuickSight to perform persona-centric data analytics
- The steps that data follows through the architecture are as follows:
- Data ingestion Data is ingested into S3 from different sources.
- Ad-hoc data processing Data curators and data scientists use Data Brew to validate, clean, and enrich the data. Amazon Athena is also used to run ad-hoc queries to analyze the data in the lake. The transformation is shared with data engineers to set up batch processing.
- Batch data processing Data engineers or developers set up batch jobs in AWS Glue and AWS Glue DataBrew. Jobs can be event-triggered, or can be scheduled to run periodically.
- Data analytics Data and business analysts can now analyze prepared datasets in Amazon Redshift, or in S3 using Athena.
- Data visualizations Business analysts can create visuals in QuickSight. Data curators can enrich data from multiple sources. Administrators can enforce security and data governance. Developers can embed the QuickSight dashboard in applications.
Derive insights with outside-in data movement
- You can also move data in the other direction: from the outside-in. For example, you can copy query results for sales of products in a given Region from your data warehouse into your data lake, to run product recommendation algorithms against a larger data set using machine learning. Think of this concept as outside-in datamovement.
-> Derive insights from Amazon DynamoDB data for real-time prediction with Amazon SageMaker
Amazon DynamoDB is a fast NoSQL database used by applications that need consistent, single-digit millisecond latency. Customers want to move valuable data in DynamoDB into S3 to derive insights.
This data in S3 can be the primary source for understanding customers past behavior, predicting future behavior, and generating downstream business value.
The following diagram illustrates the Lake House outside-in data movement with DynamoDB data to derive personalized recommendations.
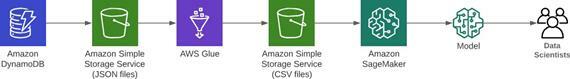
Derive insights from Amazon DynamoDB data for real-time prediction with Amazon SageMaker
- The steps that data follows through the architecture are as follows:
- Export DynamoDB tables as JSON into S3.
- Exported JSON files are converted to comma-separated value (.csv) format touse as a data source for Amazon SageMaker by using AWS Glue.
- Amazon SageMaker renews the model artifact and updates the endpoint.
- The converted .csv file is available for ad hoc queries with Athena.
-> Derive insights from Amazon Aurora data with Apache Hudi, AWS Glue, AWS DMS, and Amazon Redshift
AWS Database Migration Service (AWS DMS) can replicate the data from your source systems to S3. When the data is in S3, customers process it based on their analytics requirements.
A typical requirement is to sync the data in S3 with the updates on the source systems. Although its easy to apply updates on a relational database management system (RDBMS) that backs an online source application, its difficult to apply this CDC process on your data lakes. Apache Hudi is a good way to solve this problem. Currently, you can use Hudi on Amazon EMR to create Hudi tables.
The following diagram illustrates the Lake House outside-in data movement with Amazon Aurora Postgres-changed data to derive analytics.
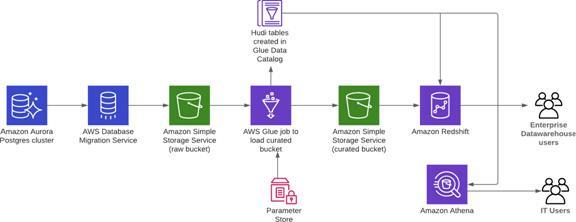
Derive insights from Amazon Aurora data with Apache Hudi, AWS Glue, AWS DMS, and Amazon Redshift
- The steps that data follows through the architecture are as follows:
- AWS DMS replicates the data from the Aurora cluster to the raw S3 bucket.
- Use Apache Hudi to create tables in the AWS Glue Data Catalog using AWS Glue jobs. An AWS Glue job (HudiJob) that is scheduled to run at a frequency set in the ScheduleToRunGlueJob parameter.
- This job reads the data from the raw S3 bucket, writes to the curated S3 bucket, and creates a Hudi table in the Data Catalog.
- The job also creates an Amazon Redshift external schema in the Amazon Redshift cluster.
You can now query the Hudi table in Amazon Athena or Amazon Redshift.
Refer to the blog post Creating a source to Lakehouse data replication pipe using Apache Hudi, AWS Glue, AWS DMS, and Amazon Redshift for additional details.
Derive insights with moving data around the perimeter
In other situations, you want to move data from one purpose-built data store to another: data movement around-the-perimeter.
For example, you may copy the product catalog data stored in your database to your search service to make it easier to look through your product catalog and offload the search queries from the database. We think of this concept as data movement around the perimeter.
-> Derive insights from your data lake, data warehouse and operational databases
A data warehouse is a database optimized to analyze relational data coming from transactional systems and line of business applications.
Amazon Redshift is a fast, fully managed data warehouse that makes it simple and cost-effective to analyze data using standard SQL and existing Business Intelligence (BI) tools.
To get information from unstructured data that would not fit in a data warehouse, you can build a data lake. A data lake is a centralized repository that allows you to store all your structured and unstructured data at any scale. With a data lake built on Amazon S3, you can easily run big data analytics and use ML to gain insights from your semistructured (such as JSON, XML) and unstructured datasets.
AWS is launching two new features to help you improve the way you manage your data warehouse and integrate with a data lake:
- Data Lake Export to unload data from an Amazon Redshift cluster to S3 in Apache Parquet format, an efficient open columnar storage format optimized for analytics.
- Federated Query to be able, from an Amazon Redshift cluster, to query:o Across data stored in the clustero In your S3 data lakeo In one or more Amazon Relational Database Service (Amazon RDS) for PostgreSQL and Amazon Aurora PostgreSQL databases
The following diagram illustrates the moving the data around the perimeter Lake House approach with S3, Amazon Redshift, Amazon Aurora PostgreSQL, and Amazon EMR to derive analytics.
Derive insights from your data lake, data warehouse and operational databases
- The steps that data follows through the architecture are as follows:
- Using the Redshift data lake export You can unload the result of a Redshift query to an S3 data lake in Apache Parquet format. The Parquet format is up to 2x faster to unload, and consumes up to 6x less storage in S3, compared to text formats. Redshift Spectrum enables you to query data directly from files in S3without moving data. Or, you can use Amazon Athena, Amazon EMR, orAmazon SageMaker to analyze the data.
Using the Redshift federated query You can also access data in Amazon RDS and Aurora PostgreSQL stores directly from your Amazon Redshift data warehouse. In this way, you can access data as soon as it is available. By using federated queries in Amazon Redshift, you can query and analyze data across operational databases, data warehouses, and data lakes.
See the blog post New for Amazon Redshift Data Lake Export and Federated Query for additional details.
-> Derive insights from your data lake, data warehouse, and purpose-built analytics stores by using Glue Elastic Views
AWS Glue Elastic Views automates the flow of data from one AWS location to another, helping to eliminate the need for data engineers to write complex extract, transform and load (ETL) or extract, load and transform (ELT) scripts to facilitate data movement in the AWS Cloud. By utilizing CDC technology, you can be assured that youre getting the latest changes from the source data sources.
You can just create a view using SQL and pull data out of databases, like DynamoDB or Aurora, and then you can pick a target like Amazon Redshift or S3 or Elastic Search Service, and all changes will propagate through.
You can scale up and down automatically. AWS also monitors that flow of data for any change, so all the error handling and monitoring is no longer your responsibility. It simplifies that data movement across services.
AWS Glue Elastic Views builds on Athenas federated query capability by making it easier for users to get access to the most up-to-date data while also enabling them to query data wherever it might resideall using SQL.
The preview of AWS Glue Elastic Views supports DynamoDB and Aurora as sources, and Amazon Redshift and Elasticsearch as targets. The goal is for AWS to add more supported sources and destinations over time. Its also welcoming customers and partners to use the Elastic Views API to add support for their databases and data stores, too.
The following diagram illustrates the moving the data around the perimeter Lake House approach with AWS Glue Elastic Views to derive insights.

Derive insights from your data lake, data warehouse, and purpose-built analytics stores by using AWS Glue Elastic Views
Conclusion
- A Lake House architecture, built on a portfolio of purpose-built services, helps you quickly get insight from all your data to all your users. It enables you to build for the future so you can easily add new analytic approaches and technologies as they becomeavailable.
Hope this guide helps you with Designing the Analytics patterns using a Lake House approach on AWS.
Let me know your thoughts in the comment section
And if you haven't yet, make sure to follow me on below handles:
connect with me on LinkedIn
connect with me on Twitter
follow me on github
Do Checkout my blogs
Like, share and follow me for more content.

Original Link: https://dev.to/aws-builders/designing-the-analytics-patterns-using-a-lake-house-approach-on-aws-2hh6
Dev To
More About this Source Visit Dev To