
An Interest In:
Web News this Week
- March 27, 2024
- March 26, 2024
- March 25, 2024
- March 24, 2024
- March 23, 2024
- March 22, 2024
- March 21, 2024
Some of Our Sources
- Engadget
- Techcrunch
- Just Creative
- TutsPlus - Design
- Creative Curio
- Inspiredology
- Web Design Ledger
- Wal You
- Freelance Switch
- Android Headlines
Help Webnuz
Referal links:
How to Draw Bar Charts Using JavaScript and HTML5 Canvas
In an earlier tutorial we covered how to draw a pie chart or doughnut chart using HTML5 canvas. In this tutorial I will show you how to use JavaScript and the HTML5 canvas as a means to graphically display data by using bar charts.
There are easier ways to create charts than coding one from scratch, for example this complete charting library from CodeCanyon.
But if you want to know what it takes to create a library like this, this tutorial is for you.
What Is a Bar Chart?
Bar charts are very common tools used to represent numerical data. From financial reports to PowerPoint presentations to infographics, bar charts are used very often since they offer a view of numerical data that is very easy to understand.
Bar charts represent numerical data using bars, which are rectangles with either their widths or heights proportional to the numerical data that they represent.
There are many types of bar charts:
- horizontal bar charts and vertical bar charts depending on the chart orientation
- stacked bar charts or classic bar charts for representing multiple series of data
- 2D or 3D bar charts
- etc.
What Are the Components of a Bar Chart?
Let's take a look at the components that make up a bar chart regardless of its type:
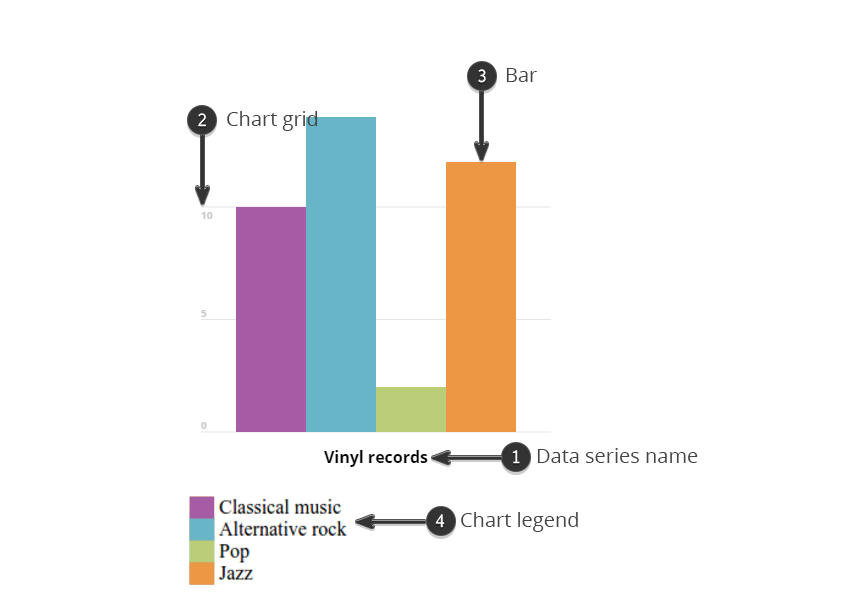
- The chart data: these are sets of numbers and associated categories which are represented by the chart.
- Name of the data series (1).
- The chart grid (2): giving a reference system so that the visual representation can be easily understood.
- The bars (3): color-filled rectangles with dimensions proportional to the data represented.
- Chart legend (4): shows the correspondence between the colors used and the data they represent.
Now that we know the components of a bar chart, let's see how we can write the JavaScript code to draw a chart like this.
Drawing the Bar Chart Using JavaScript
Setting Up the JS Project
To start drawing using JavaScript and the HTML5 canvas, we will need to set up our project like this:
- Create a folder to hold the project files; let's call this folder
bar-chart-tutorial. - Inside the project folder, create a file and call it
index.html. This will contain our HTML code. - Also inside the project folder, create a file and call it
script.js. This will contain the JavaScript code for drawing the bar chart.
We'll keep things very simple and add the following code inside index.html:
<html>
<body>
    <canvas id="myCanvas"></canvas>
    <script type="text/javascript" src="script.js"></script>
</body>
</html>
We have the <canvas> element with the ID myCanvas so that we can reference it in our JS code. We then load the JS code via the <script> tag.
Add the following code in the script.js file:
var myCanvas = document.getElementById("myCanvas");
myCanvas.width = 300;
myCanvas.height = 300;

var ctx = myCanvas.getContext("2d");
This gets a reference to the canvas element and then sets the width and height to 300px. To draw on the canvas, we only need a reference to its 2D context, which contains all the drawing methods.
Adding a Few Helper Functions
Drawing the bar chart only requires knowing how to draw two elements:
- drawing a line: for drawing the grid lines
- drawing a color-filled rectangle: for drawing the bars of the chart
Let's create the helper JS functions for these two elements. We will add the functions in our script.js file.
function drawLine(ctx, startX, startY, endX, endY,color){
    ctx.save();
    ctx.strokeStyle = color;
    ctx.beginPath();
    ctx.moveTo(startX,startY);
    ctx.lineTo(endX,endY);
    ctx.stroke();
    ctx.restore();
}
The drawLine function takes six parameters:
ctx: reference to the drawing contextstartX: the X coordinate of the line starting pointstartY: the Y coordinate of the line starting pointendX: the X coordinate of the line end pointendY: the Y coordinate of the line end pointcolor: the color of the line
We are modifying the color settings for the strokeStyle. This determines the color used to draw the line. We use ctx.save() and ctx.restore() so that we don't affect the colors used outside this function.
We draw the line by calling beginPath(). This informs the drawing context that we are starting to draw something new on the canvas. We use moveTo() to set the starting point, call lineTo() to indicate the end point, and then do the actual drawing by calling stroke().
Another helper function that we need is a function to draw a bar—which is a color-filled rectangle. Let's add it to script.js:
function drawBar(ctx, upperLeftCornerX, upperLeftCornerY, width, height,color){
    ctx.save();
    ctx.fillStyle=color;
    ctx.fillRect(upperLeftCornerX,upperLeftCornerY,width,height);
    ctx.restore();
}
The drawBar function takes six parameters:
ctx: reference to the drawing contextupperLeftCornerX: the X coordinate of the bar's upper left cornerupperLeftCornerY: the X coordinate of the bar's upper left cornerwidth: the width of the barheight: the height of the barcolor: the color of the bar
The Bar Chart Data Model
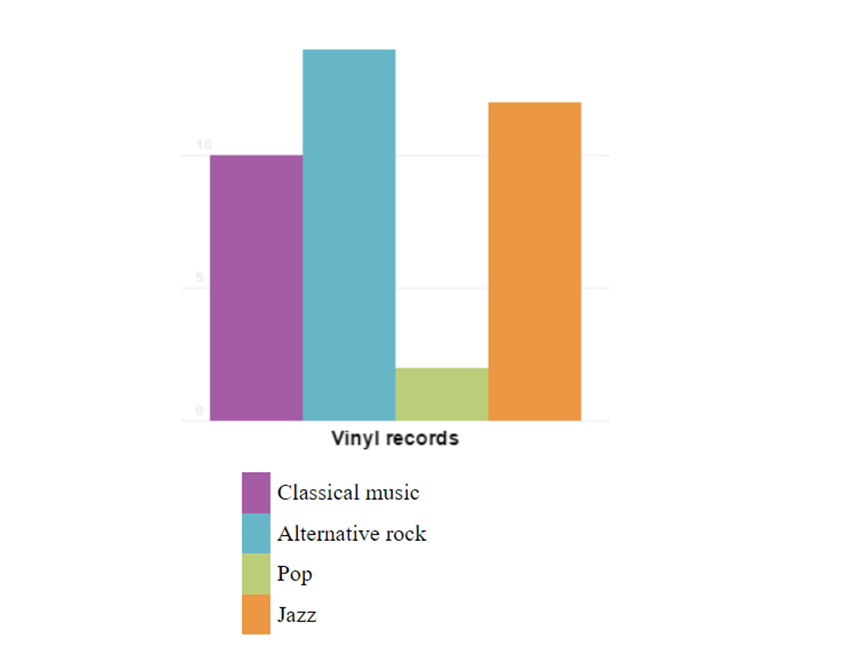
Now that we have the helper functions in place, let's move on to the chart's data model. All types of chart, including bar charts, have a data model behind them. The data model is a structured set of numerical data. For this tutorial we will use a data series of categories and their associated numerical values representing the number of vinyl records in my collection of records grouped by music genre:
- Classical music: 10
- Alternative rock: 14
- Pop: 2
- Jazz: 12
We can represent this in JavaScript in the form of an object. Let's add it to our script.js file:
var myVinyls = {
    "Classical music": 10,
    "Alternative rock": 14,
    "Pop": 2,
    "Jazz": 12
};
Implementing the Bar Chart Component
Let's implement the component that will do the actual drawing of our bar chart. We will do this by adding the following JavaScript object to our script.js file:
var Barchart = function(options){
    this.options = options;
    this.canvas = options.canvas;
    this.ctx = this.canvas.getContext("2d");
    this.colors = options.colors;

    this.draw = function(){
        var maxValue = 0;
        for (var categ in this.options.data){
            maxValue = Math.max(maxValue,this.options.data[categ]);
        }
        var canvasActualHeight = this.canvas.height - this.options.padding * 2;
        var canvasActualWidth = this.canvas.width - this.options.padding * 2;

        //drawing the grid lines
        var gridValue = 0;
        while (gridValue <= maxValue){
            var gridY = canvasActualHeight * (1 - gridValue/maxValue) + this.options.padding;
            drawLine(
                this.ctx,
                0,
                gridY,
                this.canvas.width,
                gridY,
                this.options.gridColor
            );

            //writing grid markers
            this.ctx.save();
            this.ctx.fillStyle = this.options.gridColor;
            this.ctx.font = "bold 10px Arial";
            this.ctx.fillText(gridValue, 10,gridY - 2);
            this.ctx.restore();

            gridValue+=this.options.gridScale;
        }

        //drawing the bars
        var barIndex = 0;
        var numberOfBars = Object.keys(this.options.data).length;
        var barSize = (canvasActualWidth)/numberOfBars;

        for (categ in this.options.data){
            var val = this.options.data[categ];
            var barHeight = Math.round( canvasActualHeight * val/maxValue) ;
            drawBar(
                this.ctx,
                this.options.padding + barIndex * barSize,
                this.canvas.height - barHeight - this.options.padding,
                barSize,
                barHeight,
                this.colors[barIndex%this.colors.length]
            );

            barIndex++;
        }

    }
}
The class starts by storing the options passed as parameters. It stores the canvas reference and creates a drawing context also stored as a class member. Then it stores the colors array passed as options.
The next part is the most consistent, the draw() function. This will draw the chart by first drawing the grid lines, the grid markers and then the bars using the parameters passed via the options object.
Looking at the draw() function, we can see that first we calculate the maximum value for our data model. We need this number because we will need to scale all the bars according to this value and according to the size of the canvas. Otherwise, our bars might go outside the display area, and we don't want that.
The canvasActualHeight and canvasActualWidth variables store the height and width of the canvas adjusted using the value of the padding passed via options. The padding variable indicates the number of pixels between the edge of the canvas and the chart inside.
We then draw the grid lines of the chart. The options.gridScale variable sets the step used for drawing the lines. So a gridScale of 10 will mean drawing grid lines every 10 units.
To draw the grid lines, we use the helper function drawLine(); as for the color of the grid lines, we take it from the options.gridColor variable. Please note that the canvas coordinates start from 0,0 in the top left corner and increase towards the right and bottom, while our grid values increase in value from the bottom towards the top. That is why we used 1 - gridValue/maxValue in the formula calculating the gridY value.
For every grid line, we also draw the value of the grid line 2 pixels above the grid line (that's why we have gridY - 2 for the Y coordinates of the text).
Next we draw the bars by using the helper function drawBar(). The math for calculating the height and width of each bar is pretty straightforward; it takes into account the padding and the value and color for each category in the chart's data model.
Using the Bar Chart Component
Let's now see how to use the Barchart class implemented above. We need to instantiate the class and call the draw() function. Add the following code to the script.js file:
var myBarchart = new Barchart(
    {
        canvas:myCanvas,
        padding:10,
        gridScale:5,
        gridColor:"#eeeeee",
        data:myVinyls,
        colors:["#a55ca5","#67b6c7", "#bccd7a","#eb9743"]
    }
);
myBarchart.draw();
The code creates a new instance of the Barchart class with the required options. Loading the index.html in a browser should produce a result like this:

Adding the Data Series Name and Chart Legend
To add the data series name below the chart, we need to add the following code in the script.js file after the for-loop that draws the bar:
        ...
        //drawing series name
        this.ctx.save();
        this.ctx.textBaseline="bottom";
        this.ctx.textAlign="center";
        this.ctx.fillStyle = "#000000";
        this.ctx.font = "bold 14px Arial";
        this.ctx.fillText(this.options.seriesName, this.canvas.width/2,this.canvas.height);
        this.ctx.restore();
        ...
We also need to change the way we call the Barchart component like this:
var myBarchart = new Barchart(
    {
        canvas:myCanvas,
        seriesName:"Vinyl records",
        padding:20,
        gridScale:5,
        gridColor:"#eeeeee",
        data:myVinyls,
        colors:["#a55ca5","#67b6c7", "#bccd7a","#eb9743"]
    }
);
myBarchart.draw();
And here is how the result looks:

To add the legend, we first need to modify index.html to look like this:
<html>
<body>
    <canvas id="myCanvas" style="background: white;"></canvas>
    <legend for="myCanvas"></legend>
    <script type="text/javascript" src="script.js"></script>
</body>
</html>
The legend tag will be used as a placeholder for the chart's legend. The for attribute links the legend to the canvas holding the chart. We now need to add the code that creates the legend. We will do this in the index.js file after the code that draws the data series name. The code identifies the legend tag corresponding to the chart, and it will add the list of categories from the chart's data model together with the corresponding color. The resulting index.js file will look like this:
var myCanvas = document.getElementById("myCanvas");
myCanvas.width = 300;
myCanvas.height = 300;

var ctx = myCanvas.getContext("2d");

function drawLine(ctx, startX, startY, endX, endY,color){
    ctx.save();
    ctx.strokeStyle = color;
    ctx.beginPath();
    ctx.moveTo(startX,startY);
    ctx.lineTo(endX,endY);
    ctx.stroke();
    ctx.restore();
}

function drawBar(ctx, upperLeftCornerX, upperLeftCornerY, width, height,color){
    ctx.save();
    ctx.fillStyle=color;
    ctx.fillRect(upperLeftCornerX,upperLeftCornerY,width,height);
    ctx.restore();
}

var myVinyls = {
    "Classical music": 10,
    "Alternative rock": 14,
    "Pop": 2,
    "Jazz": 12
};

var Barchart = function(options){
    this.options = options;
    this.canvas = options.canvas;
    this.ctx = this.canvas.getContext("2d");
    this.colors = options.colors;

    this.draw = function(){
        var maxValue = 0;
        for (var categ in this.options.data){
            maxValue = Math.max(maxValue,this.options.data[categ]);
        }
        var canvasActualHeight = this.canvas.height - this.options.padding * 2;
        var canvasActualWidth = this.canvas.width - this.options.padding * 2;

        //drawing the grid lines
        var gridValue = 0;
        while (gridValue <= maxValue){
            var gridY = canvasActualHeight * (1 - gridValue/maxValue) + this.options.padding;
            drawLine(
                this.ctx,
                0,
                gridY,
                this.canvas.width,
                gridY,
                this.options.gridColor
            );

            //writing grid markers
            this.ctx.save();
            this.ctx.fillStyle = this.options.gridColor;
            this.ctx.textBaseline="bottom";
            this.ctx.font = "bold 10px Arial";
            this.ctx.fillText(gridValue, 10,gridY - 2);
            this.ctx.restore();

            gridValue+=this.options.gridScale;
        }

        //drawing the bars
        var barIndex = 0;
        var numberOfBars = Object.keys(this.options.data).length;
        var barSize = (canvasActualWidth)/numberOfBars;

        for (categ in this.options.data){
            var val = this.options.data[categ];
            var barHeight = Math.round( canvasActualHeight * val/maxValue) ;
            drawBar(
                this.ctx,
                this.options.padding + barIndex * barSize,
                this.canvas.height - barHeight - this.options.padding,
                barSize,
                barHeight,
                this.colors[barIndex%this.colors.length]
            );

            barIndex++;
        }

        //drawing series name
        this.ctx.save();
        this.ctx.textBaseline="bottom";
        this.ctx.textAlign="center";
        this.ctx.fillStyle = "#000000";
        this.ctx.font = "bold 14px Arial";
        this.ctx.fillText(this.options.seriesName, this.canvas.width/2,this.canvas.height);
        this.ctx.restore();

        //draw legend
        barIndex = 0;
        var legend = document.querySelector("legend[for='myCanvas']");
        var ul = document.createElement("ul");
        legend.append(ul);
        for (categ in this.options.data){
            var li = document.createElement("li");
            li.style.listStyle = "none";
            li.style.borderLeft = "20px solid "+this.colors[barIndex%this.colors.length];
            li.style.padding = "5px";
            li.textContent = categ;
            ul.append(li);
            barIndex++;
        }
    }
}


var myBarchart = new Barchart(
    {
        canvas:myCanvas,
        seriesName:"Vinyl records",
        padding:20,
        gridScale:5,
        gridColor:"#eeeeee",
        data:myVinyls,
        colors:["#a55ca5","#67b6c7", "#bccd7a","#eb9743"]
    }
);
Which will produce a final result looking like this:

Congratulations
We have seen that drawing charts using the HTML5 canvas is actually not that hard. It only requires a bit of math and a bit of JavaScript knowledge. You now have everything you need for drawing your own bar charts.
If you want a quick and easy solution for creating not only bar charts, but loads of other types of charts, you can download the Infographic Charts and Graphics HTML Tags Library or its WordPress plugin counterpart Charts and Graphs WordPress Visual Designer.
Original Link:
TutsPlus - Code
 Tuts+ is a site aimed at web developers and designers offering tutorials and articles on technologies, skills and techniques to improve how you design and build websites.
More About this Source Visit TutsPlus - Code