
An Interest In:
Web News this Week
- April 29, 2024
- April 28, 2024
- April 27, 2024
- April 26, 2024
- April 25, 2024
- April 24, 2024
- April 23, 2024
Some of Our Sources
- Team Treehouse
- Spoon Graphics
- Smashing Magazine
- Inspiredology
- CSS Globe
- Line 25
- 24 Ways
- Specky Boy
- Spyre Studios
- Hashedout
Help Webnuz
Referal links:
How to Track Stock Data in Google Sheets - With GOOGLEFINANCE Function
Google Drive isn't just a place to store files; instead, it's a powerful web-base productivity suite. This tutorial will focus on using Google Sheets, Google's web-based spreadsheet app, to work with stock data.
Stocks represent fractional ownership of a company. Stocks are traded on an exchange like the New York Stock Exchange (NYSE), NASDAQ, London Stock Exchange (LSE), and more. You can buy and sell stock through brokers.

Google also offers Google Finance as a way to view stock data, including charts to view company performance over time. The best part is that Google offers a way to seamlessly pull data from their Google Finance service into Sheets.
In this tutorial, you'll learn how to use the GOOGLEFINANCE function in Google Sheets to bring data over from Google Finance and insert it into a spreadsheet.
To get started with this tutorial, make sure that you have a Google account, and head over to Google Drive. Create a new Sheet, and keep reading to learn more.
Why Track Stock Data?
For many, tracking stock data is a hobby. Stock price is widely considered to be an indicator of how companies are performing. If you're interested in the success of a company, you might keep an eye on their stock price to gauge performance.
For others, investing in stocks is a way to plan for retirement. Many people purchase stocks, bonds, and mutual funds expecting them to increase in value over time and fund their non-working years.
Most importantly: stock prices are always changing. If you want to monitor stock prices, you need an easy way to keep your data up to date.
No matter why you're tracking stock data, the Google Sheets connection to Google Finance is the easiest way I've found to get data on stocks into a spreadsheet. Let's learn how.
How to Track Stocks With GOOGLEFINANCE Function (Quick Video Tutorial)
Check out the screenshot below to learn how to build a dynamic stock tracking spreadsheet in Google Sheets.
To learn more about using the GOOGLEFINANCE function, check out my step-by-step guide below.
Getting Stock Data
The first thing that I like to do when setting up a stock analysis spreadsheet is choose the companies that I'll look at. You'll need to identify their stock symbols, which are a few letters that identify companies on stock exchanges. For example, Apple's stock symbol is AAPL, while Microsoft's symbol is MSFT.

You can usually find stock symbols for companies with a quick search, or you can use a tool like the Yahoo Finance lookup tool to find stock symbols for a company of your choice.
When I'm comparing companies, I'll capture a list of stock symbols in a Google sheet in a column:

In Google Sheets, we can use the =GOOGLEFINANCE function to import stock data. To get started, click in a cell and start typing the function.
No need to type the company's full name for each stock symbol. Let's write our first =GOOGLEFINANCE function to look at the stock symbol and insert a company's name. Here's the formula that we'll use:
=GOOGLEFINANCE(stock symbol,"name")
In the example below, I use the formula on cell A2 to match "Volkswagen AG" to the stock symbol VLKAY. Then, just pull the formula down to pull the company name for each stock symbol.

Now that we've captured the stock symbols and companies we're watching, let's get some financial data about them.
Current Stock Price
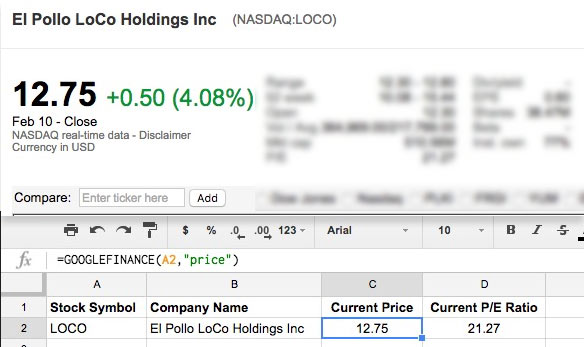
To get a stock price, use the GOOGLEFINANCE formula as follows:
=GOOGLEFINANCE(stock symbol,"price")
You can type a stock symbol in the parentheses, or give the formula a cell with the stock symbol to pull the price. In the screenshot below, you'll see how I use the formula and pull it down to get the stock price for each company.

The price that Google Sheets pulls in is the current stock price, and will refresh when the spreadsheet is opened.
Stock Price From a Specific Date
What if you want to lock in the stock price for a specific day, or look up what a stock was worth in the past? We can do that in our spreadsheet.
Let's use this formula to get the price at close for Amazon's stock on February 1st:
=GOOGLEFINANCE("AMZN","price",date(2017,2,7))
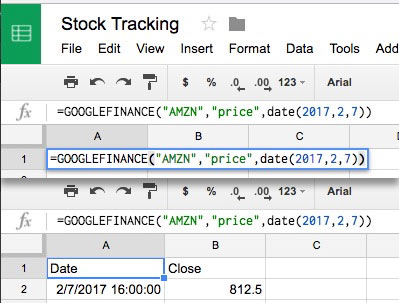
Notice that this formula creates a grid with some extra data, including a "Date" and "Close" header, as well as the date and price at closing.
If you want just the price at closing, we'll need to wrap our formula in an INDEX and pull only the lower right box (the price.) Here's a formula you can use:
=INDEX(GOOGLEFINANCE("AMZN","price",date(2017,2,7)),2,2)
I've simply wrapped the formula with an INDEX, and then put the ",2,2)" at the end of the formula to pull only the stock price without the headers.

Price History for a Stock
Earlier, I mentioned that stock price reflects company performance and future expectations. Tracking stock price over a period of time is a great way to understand how investors view the company.
Here's the function that you can use to get the price history of a stock:
=GOOGLEFINANCE("F", "price", DATE(2017,1,1), DATE(2017,2,11), "DAILY")
Let's break down that formula:
- The formula opens up with the standard =GOOGLEFINANCE wrapper.
- The "F" in parentheses tells the function to get data for Ford, our stock of choice.
- Next, we give the function the attribute of "price" to specify that we want the price over a period of time.
- Then, we'll specify the start and end date to get.
- Finally, I put "DAILY" in parentheses to tell Sheets that we want to get daily stock results.
In the screenshot below, you'll see that the results are output on rows of the spreadsheet:
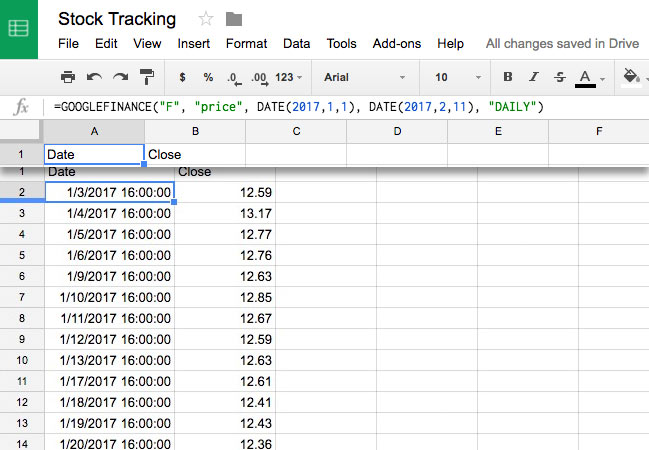
Now, you have a list of stock price over time. You can really input any length of time, and Sheets will automatically grab the data from Google Finance. From there, it's easy to turn the data into charts directly inside your spreadsheet.

We've got a great handle on stock price now. Let's look at some other powerful financial data that we can grab in Sheets.
Price-Earnings (P/E) Ratio
The price-earnings ratio, or P/E ratio is a common method for valuing companies. It divides the company's stock price by its earnings. A commonly accepted principle for valuing stocks is that a high P/E ratio for a stock indicates future growth.
To get a P/E ratio for a stock from Google Finance, use the following formula:
=GOOGLEFINANCE(stock symbol,"pe")
In the example below, I'll get the P/E ratio for a stock using a cell reference, with the example formula being:
=GOOGLEFINANCE(A3,"pe")
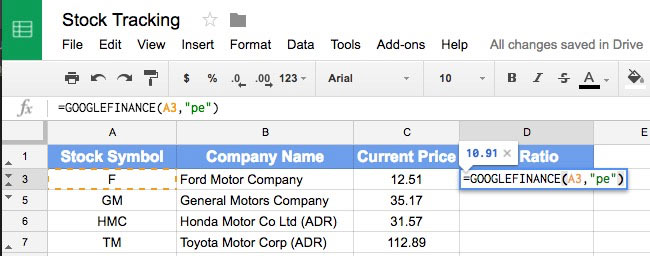
Then, I'll simply drag the formula down to find the ratio for all of my selected stocks.

How do you read a P/E ratio number? You have to survey similar companies to make them meaningful. For stocks in higher growth industries like technology (think Google or Facebook) will have higher P/E ratios than utility companies, for example.
If you're interested in how P/E ratios are calculated, check out this definition from Investopedia.
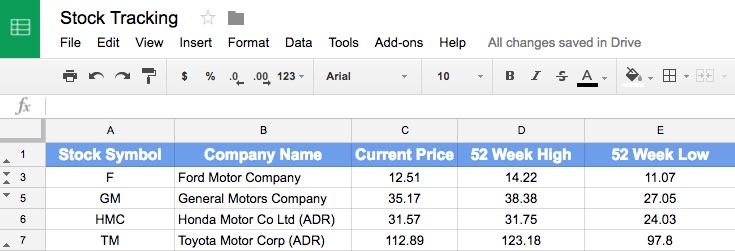
Last 52-Week Low and High
Some stocks move widely over the course of the year. It helps to keep an eye on how they fluctuate.
To get the highest price that a stock has achieved in the last 52 weeks, use the following formula:
=GOOGLEFINANCE(stock symbol,"high52")
You can also get the lowest price that a stock has closed at in the last 52 weeks:
=GOOGLEFINANCE(stock symbol,"low52")
In the screenshot below, you can see how I've applied these formulas to a list of stocks:
I frequently keep my eye on where a stock is trading in relation to its high and low points. If I'm looking to take profit and sell a stock, I try to ensure it's not at a low point.
These formulas are just a few of the available attributes that Google Sheets can pull in from Google Finance. Using a combination of these factors can help you monitor those key financial ratios and research companies—whether for fun or profit.
Recap and Keep Learning
In this tutorial, you used Google Sheets to setup a stock tracking spreadsheet. Whether you're approaching this as a hobby, learning exercise, or potential source of income, Sheets has easy integration with Google Finance to follow stocks of your choice.
- If any of the financial terms in this tutorial were unfamiliar to you, Investopedia has an excellent dictionary of financial terms.
- Google has extended documentation on the =GOOGLEFINANCE function that covers some additional features that weren't covered in this tutorial.
- Melissa Murphy has a great tutorial on How to Import and Export Documents in Google Drive.
Are you a stock picker in the making? Do you use Google Sheets or another tool to track your data? Let me know in the comments.
Original Link:
Freelance Switch
More About this Source Visit Freelance Switch