
An Interest In:
Web News this Week
- April 28, 2024
- April 27, 2024
- April 26, 2024
- April 25, 2024
- April 24, 2024
- April 23, 2024
- April 22, 2024
Some of Our Sources
- Mashable
- Techcrunch
- Joshua Blankenship
- Smashing Magazine
- Vandelay Design
- Web Designer Depot
- Naldz Graphics
- Noupe
- Web Design Ledger
- Android Dissected
Help Webnuz
Referal links:
Simplify your EKS Cluster Observability with Prometheus & Grafana
Good day fellow Bloggers,
Its been a while since I posted a blog, I have been settling down in my new role and studying for a beast of an exam coming up.
Without further delay, Kuberenetes Observability Made Easy!

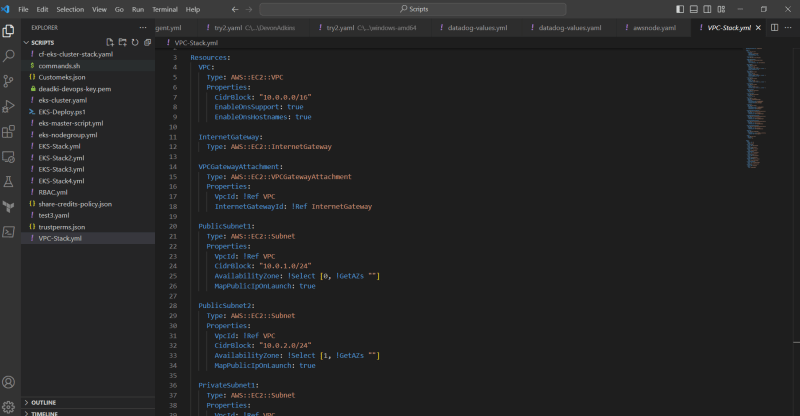
I would encourage everyone get used of the CloudFormation YAML Manifest construction, whilst we are seeing more vendor agnostic IaC platforms such as Terraform, it definitley helped me prepare for my AWS DevOps Professional Exam coming up, so I would encourage you to make sure you sharpen up your skillsets wherever you can. I have the link to the AWS CloudFormation Documentation so familiarize yourself with the whitepapers and dive right in!
https://docs.aws.amazon.com/AWSCloudFormation/latest/UserGuide/Welcome.html
The below context will give you an example of my custom YAML CloudFormation Stackset:
Once compiled you can use API Calls with the AWS CLI installed either to your WSL (Windows Sub-System for Linux) or PowerShell Terminals. The CloudFormation stacks simply build and can be destroyed and re-constructed in minutes.
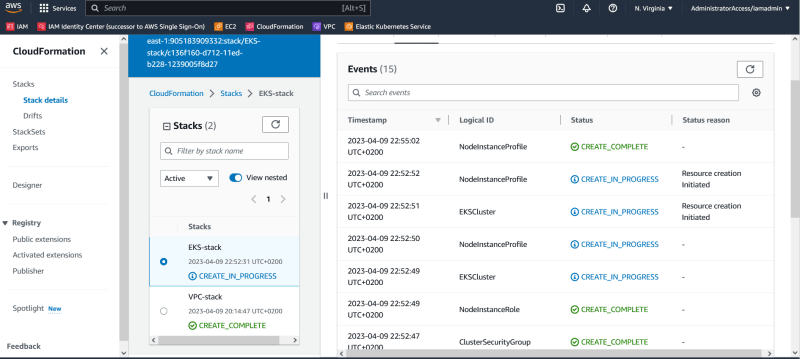
So utilizing the above toolsets I created a EKS Cluster and added a second stack with references to my existing stack.
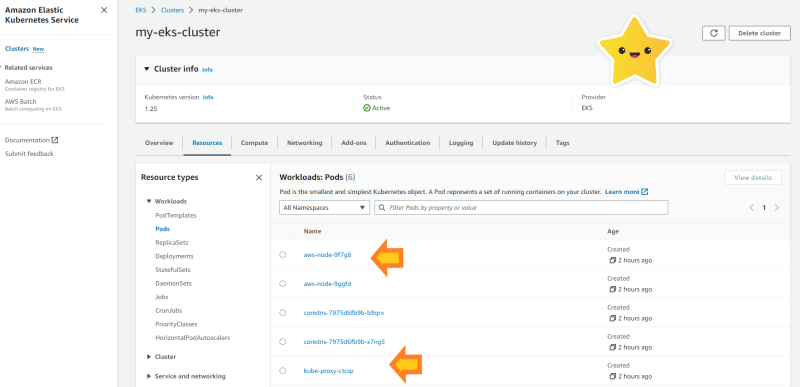
Once deployed you can then add further toolsets such as the Prometheus stack set using the Helm Community Install and your almost at the end of your race.
I will recommend installing Kubernetes Lens as its much easier to install and manage your K8s cluster then directly managing it via CLI / However I am a CLI Jockey and still prefer the terminal.
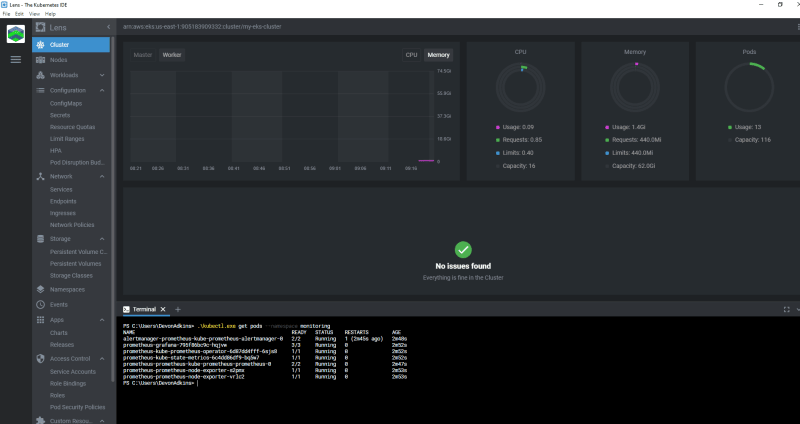
Ensure that within your settings you configure your ./Kube/Config context destination so that lens can get straight to work as per the below:

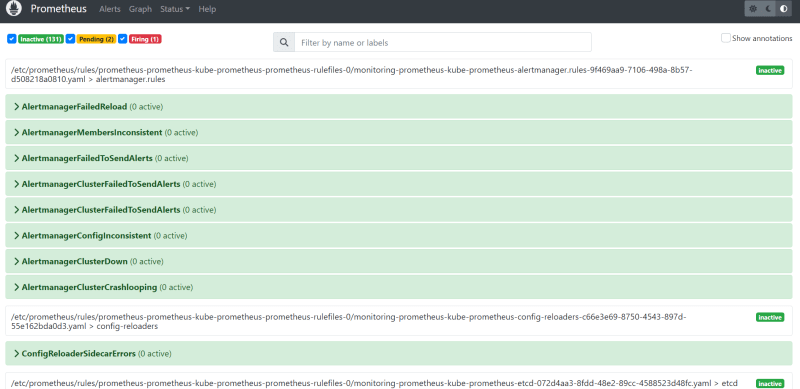
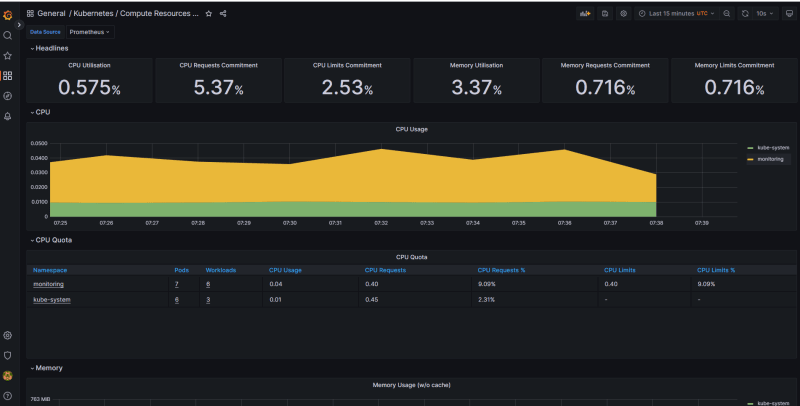
Finally once the prometheus and helm stack completes the install you will be ready to start monitoring logs, alerting & Graphs / Dashboards using both Prometheus and Grafana.
For more tutorials feel free to visit: https://deadkithedeveloper.click/
Or
Connect with me on LinkedIn via
https://www.linkedin.com/in/devonpatrick-adkins-%E2%98%81-1068781a3/
Have a great week ahead!
Regards
DevonPatrick
AWS Community Builder & Cisco Champion
Original Link: https://dev.to/aws-builders/simplify-your-eks-cluster-observability-with-prometheus-grafana-353i
Dev To
More About this Source Visit Dev To