
An Interest In:
Web News this Week
- April 26, 2024
- April 25, 2024
- April 24, 2024
- April 23, 2024
- April 22, 2024
- April 21, 2024
- April 20, 2024
Some of Our Sources
- Technology Review
- TutsPlus - Code
- The Logo Smith
- Creative Curio
- My Ink Blog
- Reencoded
- 24 Ways
- Spyre Studios
- Freelance Switch
- Design Modo
Help Webnuz
Referal links:
January 20, 2023 09:59 am GMT
Original Link: https://dev.to/sujit_mali/how-to-make-a-line-graph-in-google-sheets-4ebl
How to make a line graph in google sheets?
To make a line graph in Google Sheets, follow these steps:
Step 1: Enter the data
Enter your data in your sheets.
E.g 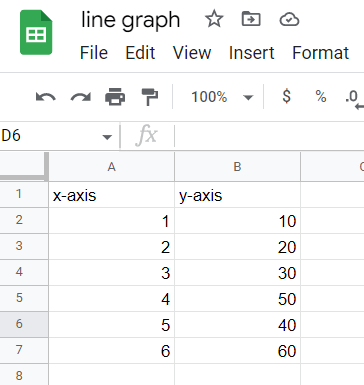
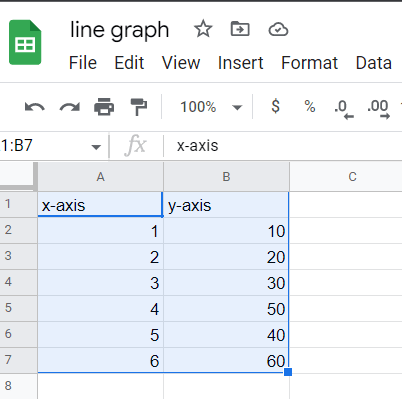
Step 2: Select the data
The second step after the step 1 is to selecting the data.
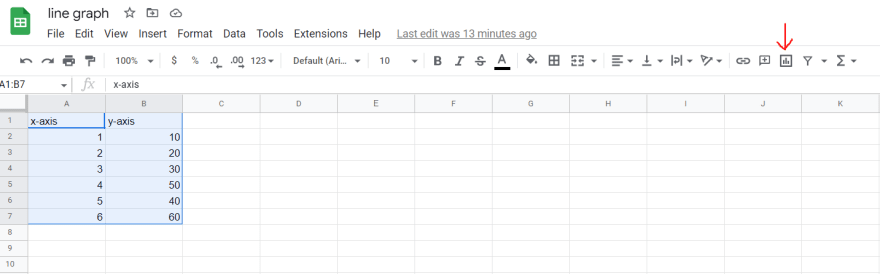
Step 3: Click on Insert Chart
Click on "Insert Chart" at top toolbar.
Step 4: Select the line chart.
Select the chart you want to create. 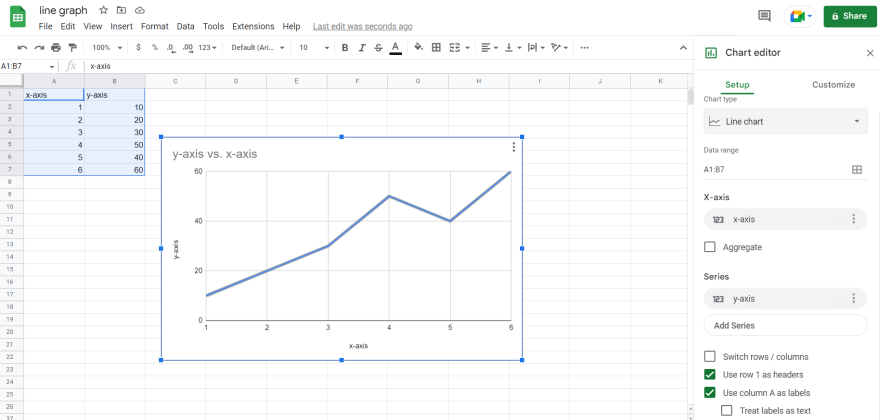
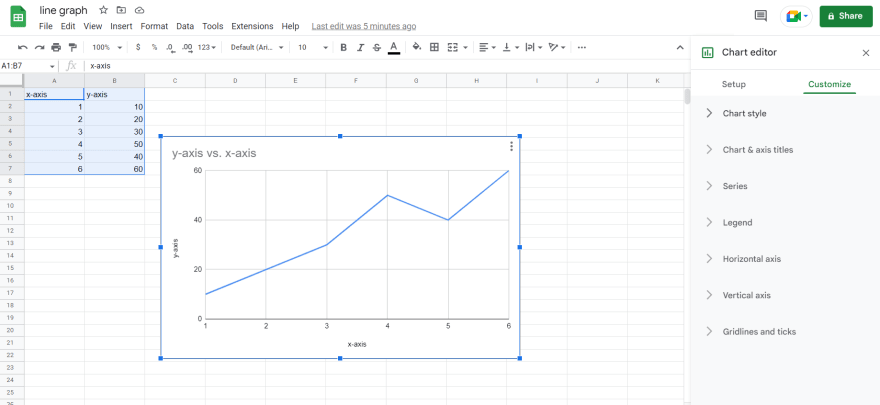
Step 5: Customize
Final step customize your chart such as Color, Point, Legend, Axis and Text.
Step 6: Download
First select your graph and click on three dots.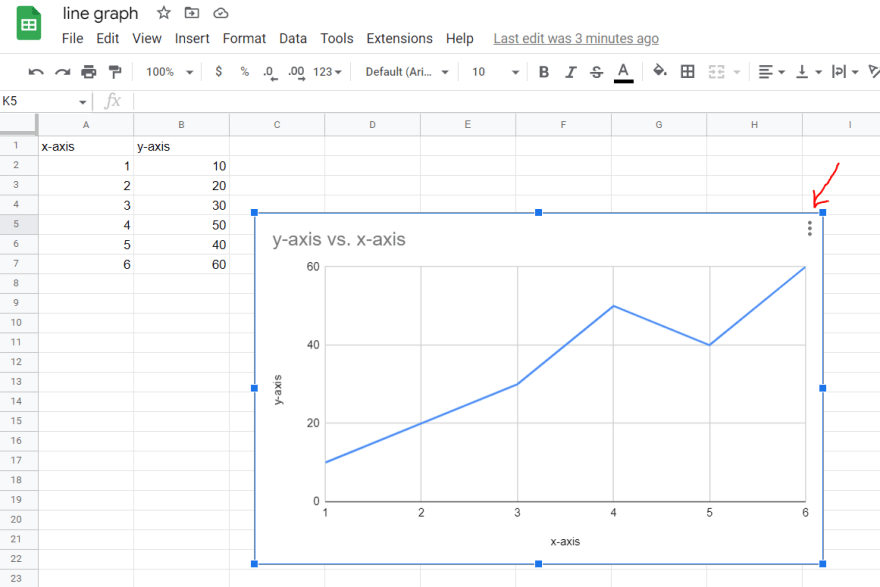
Finally download your graph as png, svg or pdf format.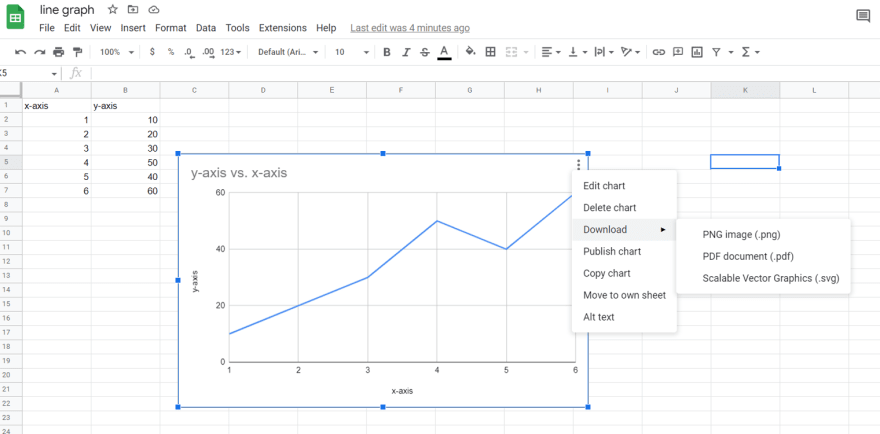
OR
You can try line graph maker to create graph easily.
Original Link: https://dev.to/sujit_mali/how-to-make-a-line-graph-in-google-sheets-4ebl
Share this article:
Tweet

View Full Article
Dev To
More About this Source Visit Dev To