
Some of Our Sources
- Technology Review
- Team Treehouse
- The Logo Smith
- Spoon Graphics
- Smashing Apps
- Web Design Ledger
- Spyre Studios
- Android Dissected
- Codrops
- Daily Now
Help Webnuz
Referal links:
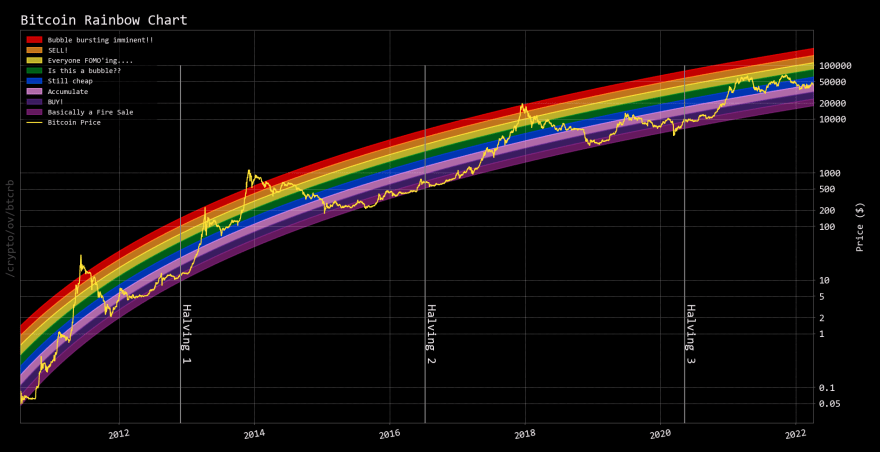
The Bitcoin Rainbow Chart!
When Jose showed this to me it was love at first sight. While pictures say a thousand words, charts typically fall well short; but not this one. The BTC Rainbow chart has a life of its own and, with inspiration (https://www.blockchaincenter.net/en/bitcoin-rainbow-chart/), he brought it to the OpenBB Terminal. How many investment research platforms bring a playful chart like this together with legacy finance in a modern terminal environment? Only one, and it's OpenBB.
Will BTC continue along Rainbow Road? Only time will tell!
This is only one of the many fascinating charts in the OpenBB Terminal! Python and open-source finance in a modern terminal environment. It's 100% MIT Open Source licensed, so sharpen those crayons!
From https://www.blockchaincenter.net/en/bitcoin-rainbow-chart/
The Rainbow Chart is not investment advice! Past performance is not an indication of future results. The Rainbow Chart is meant to be be a fun way of looking at long term price movements, disregarding the daily volatility noise. The color bands follow a logarithmic regression (introduced by Bitcointalk User trolololo in 2014), but are otherwise completely arbitrary and without any scientific basis. We never change them though. In other words: It will only be correct until one day it isnt anymore. Btwhere is the Ethereum Rainbow Chart
Join the community Discord Server for some #hotTUItalk: https://discord.com/invite/Y4HDyB6Ypu
Official website: https://openbb.co
Original Link: https://dev.to/danglewood/the-bitcoin-rainbow-chart-412j
Dev To
More About this Source Visit Dev To