
An Interest In:
Web News this Week
- April 27, 2024
- April 26, 2024
- April 25, 2024
- April 24, 2024
- April 23, 2024
- April 22, 2024
- April 21, 2024
Some of Our Sources
- Smashing Magazine
- Vandelay Design
- Web Designer Depot
- FanExtra - PSD
- 24 Ways
- Stylized Web
- Freelance Switch
- Android Headlines
- Willems Lab
- Dev To
Help Webnuz
Referal links:
Implementing Distributed Tracing in a Java application
Monitoring and troubleshooting distributed systems like those built with microservices is challenging. Traditional monitoring tools struggle with distributed systems as they were made for a single component. Distributed tracing solves this problem by tracking a transaction across components.
In this article, we will implement distributed tracing for a Java Spring Boot application with three microservices. To implement distributed tracing, we will be using open-source solutions - SigNoz and OpenTelemetry, so you can easily follow the tutorial.
We will learn more about SigNoz and OpenTelemetry, but before that, lets have a brief overview of distributed tracing.
What is Distributed Tracing?
In a microservices architecture, a user request travels through hundreds, even thousands of services before serving the user what they need. Engineering teams often responsible for maintaining single services have no visibility over how the system performs as a whole.
Read our complete guide on Distributed Tracing
Distributed tracing gives insights into how a particular service performs as part of the whole in a distributed software system. It involves passing a trace context with each user request which is then passed across hosts, services, and protocols to track the user request. The technique enables the reconstruction of the whole path of the request, which is called a trace.
A trace allows application owners to see how their entire system processed a request and identify improvement areas.
SigNoz and OpenTelemetry
OpenTelemetry is a vendor-agnostic set of tools, APIs, and SDKs used to instrument applications to create and manage telemetry data(logs, metrics, and traces). It aims to make telemetry data(logs, metrics, and traces) a built-in feature of cloud-native software applications. It is a project under CNCF with huge community backing.
OpenTelemetry provides the instrumentation layer to generate and export your telemetry data to a backend. Then, you need to choose a backend tool that will provide the data storage and visualization for your telemetry data. Thats where SigNoz comes into the picture.
SigNozis a full-stack open-source APM tool that provides metrics monitoring and distributed tracing.
We will demonstrate implementing distributed tracing in a Java application in two sections:
- Running a sample Java application with OpenTelemetry
- Visualizing traces data with SigNoz dashboards
Running a sample Spring Boot Java application with OpenTelemetry
The sample Spring Boot Java application will have three microservices and a service registry
- user-service
- orders-service
- payment-service
- discovery-service (eureka server - service registry)
Heres the architecture of the sample Java application along with OpenTelemetry and SigNoz.
 Application architecture along with SigNoz and OpenTelemetry(OTel Collector)
Pre-requisites
- Java 8 or newer
- MySql 8
- SigNoz
- Maven
Installing SigNoz
SigNoz can be installed on macOS or Linux computers in just three steps by using a simple install script.
The install script automatically installs Docker Engine on Linux. However, on macOS, you must manually installDocker Engine before running the install script.
git clone -b main https://github.com/SigNoz/signoz.gitcd signoz/deploy/./install.shYou can visit our documentation for instructions on how to install SigNoz using Docker Swarm and Helm Charts.

When you are done installing SigNoz, you can access the UI athttp://localhost:3301
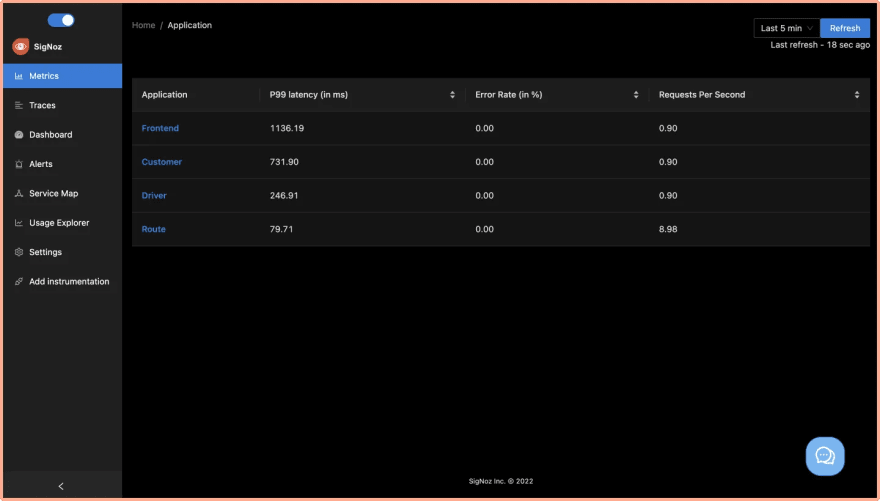 SigNoz dashboard - It shows services from a sample app that comes bundled with the application
Installing MySql
Download MySQL community version from here based on your operating system.
Once installation is complete, run the below commands to create a database for our sample nodejs app.
~ mysql -u rootmysql> create database signoz;mysql> use signoz;Installing Maven
To install maven follow below steps:
cd ~mkdir mavencd mavencurl -L https://dlcdn.apache.org/maven/maven-3/3.8.4/binaries/apache-maven-3.8.4-bin.zip -o maven.zipunzip maven.zipecho -n '\n export PATH=~/maven/apache-maven-3.8.4/bin:$PATH' >> ~/.zshrcsource ~/.zshrcVerify maven using below command mvn -version
Running sample application
Below are the steps to run the sample Java application with OpenTelemetry:
Clone the sample Spring Boot app
We will be using a sample java app at this GitHub repo.
git clone https://github.com/SigNoz/distributed-tracing-java-sample.gitcd distributed-tracing-java-sampleRun service discovery with Eureka Server
cd discovery-servermvn clean install -Dmaven.test.skipdocker build -t discovery-service:1.0.1 .docker run -d --name discovery-service -p 8761:8761 discovery-service:1.0.1You can go to http://localhost:8761/ and make sure your discover service registry with Eureka server is up and running.
 Eureka server is up and running
Setting up Opentelemetry agent
For instrumenting Java applications, OpenTelemetry has a very handy Java JAR agent that can be attached to any Java 8+ application. The JAR agent can detect a number ofpopular libraries and frameworks and instrument it right out of the box. You don't need to add any code for that.
Download thelatest version of the Java JAR agent, and copy jar agent file in your application code. We have placed the agent under the folder named agents.
 Placed OpenTelemetry Java Jar agent under a folder named agents
Setting up SigNoz as the OpenTelemetry backend
To set up OpenTelemetry to collect and export telemetry data, you need to specify OTLP (OpenTelemetry Protocol) endpoint. It consists of the IP of the machine where SigNoz is installed and the port number at which SigNoz listens.
OTLP endpoint for SigNoz - <IP of the machine>:4317
If you have installed SigNoz on your local machine, then your endpoint is 127.0.0.1:4317.
Create a start.sh script with below environment variables and move it to scripts folder. Notice that we have updated the OTLP endpoint under -Dotel.exporter.otlp.traces.endpoint=http://localhost:4317.
JAVA_OPTS="${JAVA_OPTS} \-Xms${JAVA_XMS} \-Xmx${JAVA_XMX} \-Dapplication.name=user-service-java \-Dotel.metrics.exporter=none \-Dotel.traces.exporter=otlp \-Dotel.resource.attributes=service.name=user-service-java \-Dotel.exporter.otlp.traces.endpoint=http://localhost:4317 \-Dotel.service.name=user-service-java \-Dotel.javaagent.debug=false \-javaagent:../agents/opentelemetry-javaagent.jar" Code in scripts.sh file
 Scritps.sh file under scripts folder
Run the microservices
Now you need to run your microservices. Run users-service:
cd user-servicemvn clean install -Dmaven.test.skip # Build user-service jarcd scriptssh ./start.sh # Run user-service with OTEL java agentOpen a new tab of your terminal, and run payment-service:
cd payment-servicemvn clean install -Dmaven.test.skip cd scriptssh ./start.sh Open a new tab of your terminal, and run order-service:
cd order-servicemvn clean install -Dmaven.test.skip cd scriptssh ./start.sh  Running microservices on different ports using service registry
Confirm table creation
After running the services, check if the tables ORDERS and USERS are created using the commands below:
mysql> use signoz;mysql> show tables; Checking creation of tables after running microservices
Visualizing traces data with SigNoz dashboards
To visualize the traces data with SigNoz, we first need to generate some user data by interacting with the spring boot application.
Generating user data by interacting with the sample app
You need to generate some user data to see how it appears in the SigNoz dashboard. The sample application comes with an UI to interact with the app. Use the below command in the root folder to launch the UI:
npm install -g serveserve -l 5000 u Running sample app UI
Use the buttons to interact with the app and generate some data. For example, click Create User button to create a new user in the MySQL db.
 Create a new user
Now go to SigNoz dashboard, you will notice the list of service names that we configured:
- user-service
- order-service
- payment-service
 Microservices in our Java app being monitored in the SigNoz dashboard
You can play around with the dashboard to see what data is captured. Below is a handy guide on how to use the SigNoz dashboard to see the captured data.
How to use SigNoz dashboard to analyze traces
The traces tab of the SigNoz dashboard provides powerful filters to analyze the traces data. You can use a number of filters to see traces data across many dimensions. For example:
See the count of requests by service and HTTP Status code
 Use advanced filters to see count of requests by service and HTTP status code
Run aggregates on your tracing data
You can run aggregates like avg, max, min, 50th percentile, 90th percentile on your tracing data to get analyze performance issues in your application.
 Run aggregates using the dropdown on your traces data quickly
Get more granular details by grouping traces data
You can also see these aggregates in more granular detail by grouping them by service name, operation, HTTP URL, HTTP method, etc.
 Group aggregates across a list of dimensions
Identify latency issues with Flamegraphs and Gantt charts
You can inspect each span in the table with Flamegraphs and Gantt charts to see a complete breakdown of the request. Establishing a sequential flow of the user request along with info on time taken by each part of the request can help identify latency issues quickly. Lets see how it works in the case of our sample Spring Boot app.
Go to operation filter on the left navigation and apply two filters /payment/transfer/id/{id}/amount/{amount} and service name payment-service . Click on the single event listed in the table as shown below:
 Use filters to inspect spans that you want to investigate further
You will be able to see the Flamegraph of the selected span which shows how the request traveled between the payment-service and the user-service. You can also use the Gantt chart to analyze each event in detail.
 Flamegraph and Gantt chart for the selected event showing payment service traces with HTTP semantics
 Databases traces which show semantics related to mysql db and query details
SigNoz also provides a detailed view of common semantic conventions like HTTP, network, and other attributes. The end-to-end tracing of user requests can help you to identify latency issues quickly.
Conclusion
Distributed tracing is a powerful and critical toolkit for developers creating applications based on microservices architecture. For Java Spring Boot applications based on microservices architecture, distributed tracing can enable a central overview of how requests are performing across microservices.
This lets application owners reconstruct the whole path of the request and see how individual components performed as part of the entire user request.
OpenTelemetry and SigNoz provide a great open-source solution to implement distributed tracing for your applications. You can try out SigNoz by visiting its GitHub repo
If you have any questions or need any help in setting things up, join our slack community and ping us in #support channel.

Read more about distributed tracing from SigNoz blog
Original Link: https://dev.to/signoz/implementing-distributed-tracing-in-a-java-application-29jf
Dev To
More About this Source Visit Dev To