
An Interest In:
Web News this Week
- April 26, 2024
- April 25, 2024
- April 24, 2024
- April 23, 2024
- April 22, 2024
- April 21, 2024
- April 20, 2024
Some of Our Sources
- BoingBoing
- Web Designer Wall
- Just Creative
- Smashing Apps
- Six Revisions
- Fuel Your Creativity
- Reencoded
- Line 25
- Freelance Switch
- Android Headlines
Help Webnuz
Referal links:
No-code AWS Lambda Monitoring
Auto-instrumenting AWS Lambda Monitoring didnt originate through a focus group or business plan. It started as a hackathon project that addressed the tedium of removing manual code instrumentation. Developer environments often include hundreds of AWS Lambda functions. And our existing instrumentation required initialization code to be manually placed on every single function. So to fix this, our growth team used Amazon CloudWatch to build a prototype that could instrument AWS Lambda functions.
This prototype began by using AWS CloudFormation stack to automatically create resources in a customer environment. Then we streamed Amazon CloudWatch Logs to Sentry through the Amazon Kinesis Data Firehose. This made it so all you had to do was put in your AWS account ID and create the stack using a pre-configured AWS CloudFormation stack.
But in order to get this production-ready, we had to take a closer look at a few things:
- Since we just picked a mocked-up stack trace for our demo, the streamed logs were not grouped into issues or even formatted to pull out stack traces.
- While the Amazon CloudWatch logs could display stack traces, they didnt even come close to Sentrys representation of stack traces, as they had a different use case (though thats a conversation for another day).
- Through this automated instrumentation, it wasnt possible to choose or create a project for your AWS Lambda functions, as we had hard-coded these values for the hackathon.
Ultimately, this meant that we would not use logs to productize no-code AWS Lambda monitoring, as logs would limit our tracing capabilities. Instead, we used AWS Lambda Extensions, which tied Sentrys AWS Lambda Layers along with environment variables and code wrapping to instrument AWS Lambda functions. Doing so ensured that:
- We were a part of the runtime environments that captured issues/performance and reported them in real-time.
- We could connect developers to formatted stack traces along with in-context environment variables and breadcrumbs.
- Developers were able to make changes to Sentrys instrumentation rather than creating in a black box.
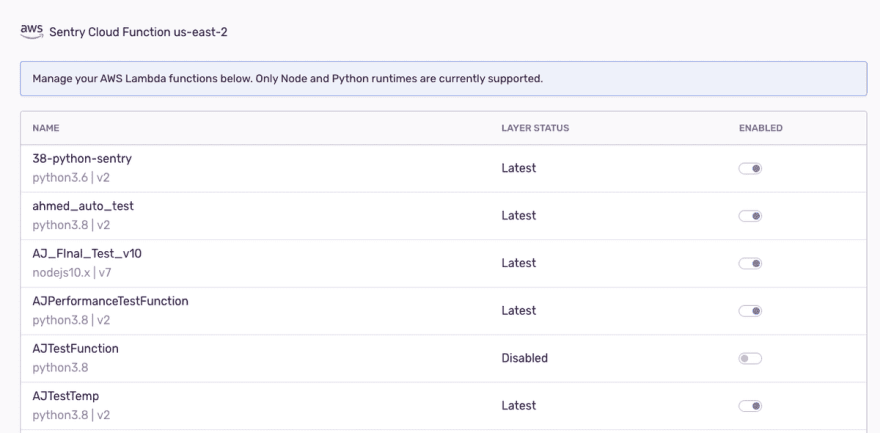
- Developers could control the sample rate for the function traces, as well as activation/deactivation of Sentry directly from the UI.
Using the AWS Lambda Layers approach and skipping the Amazon CloudWatch had two minor but manageable downsides:
- We needed a specific SDK AWS Lambda Layer for every programming language. We launched with support for Node and Python.
- Wed miss out on some metrics like memory usage and timeout issues since they are reported after an AWS Lambda function has finished executing.
Outcome
Instrumenting Sentry on your AWS Lambda functions is now as easy as following a following few simple, UI-specific steps:
1. Select Project

2. Add CloudFormation Stack
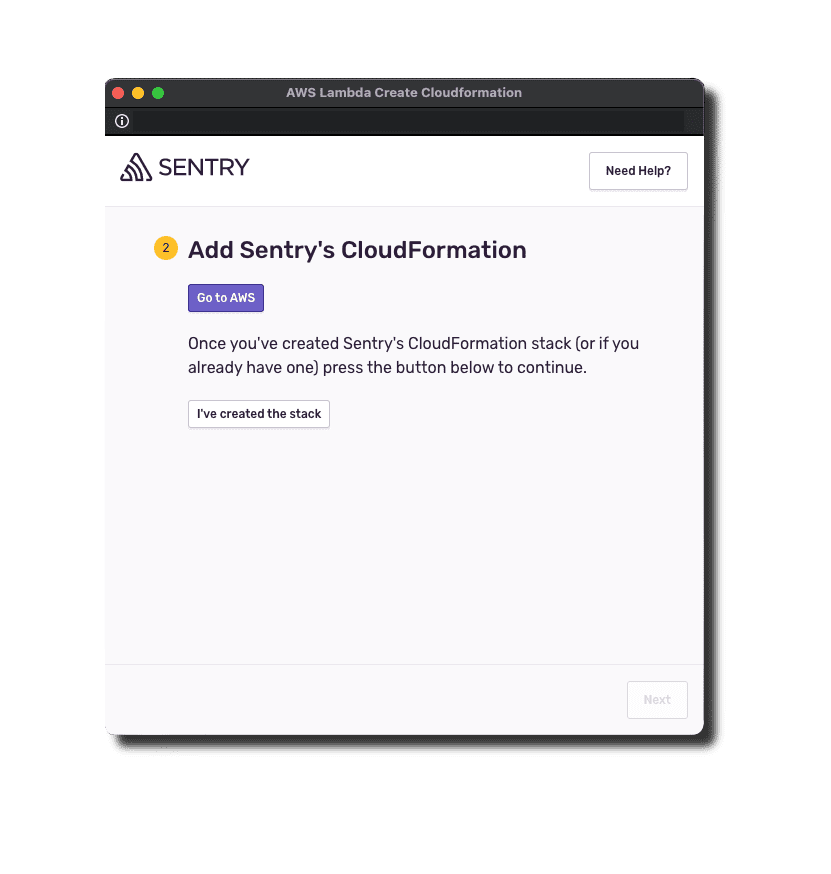
3. Select Functions to Instrument
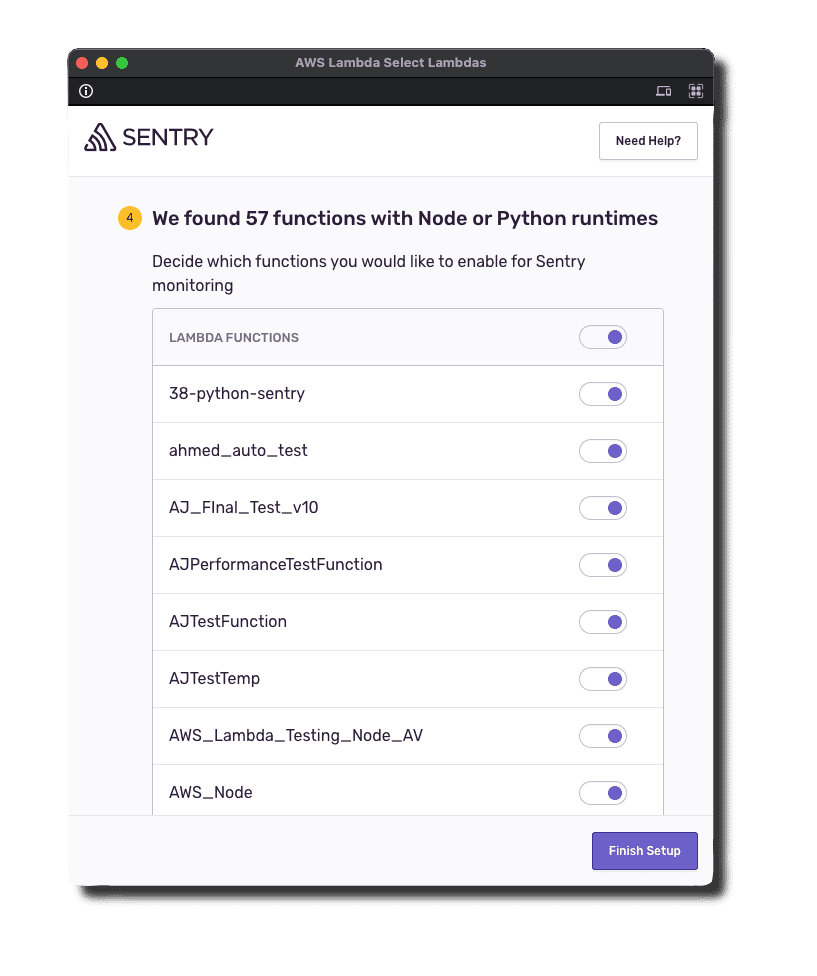
And that's it! You can even toggle function instrumentation on the fly from the AWS integration management page.
Ok, so why should you care? Well, developers seem to appreciate the value in auto-instrumentation more than a third of our instrumentations for AWS Lambda monitoring are now coming through auto-instrumentation. The folks at AWS thought it wasnt bad either. They helped us become an AWS Partner and gave us a AWS Lambda Ready Designation.
You can learn more about Sentrys support for Serverless Monitoring here.
Original Link: https://dev.to/sentry/no-code-aws-lambda-monitoring-1fbd
Dev To
More About this Source Visit Dev To