
An Interest In:
Web News this Week
- April 1, 2024
- March 31, 2024
- March 30, 2024
- March 29, 2024
- March 28, 2024
- March 27, 2024
- March 26, 2024
Some of Our Sources
- Techcrunch
- Pearsonified
- Smashing Apps
- Six Revisions
- Inspiredology
- Naldz Graphics
- Crazy Leaf Design
- Stylized Web
- Design Modo
- Android Dissected
Help Webnuz
Referal links:
How I build Crypto Tracker Chart with React

Hello Coders ,
Recently, I visit a crypto tracker site to check DogeCoin prices to see whether it going to the moon

I was curious about how to build a simplified version on that site using React, other libraries, and tools out there.
Here is the link to my cool project:
https://cryptotracker.ayeprahman.com/
So I did research to find which API to use and came across a free, reliable, and comprehensive API from the team CoinGecko.
At the same time, my goal also was to focus to find a low-level visualization tool that comprises the power of using D3 with React, flexibility, optimized speed, and bundle sizes. And I came across Visx from Airbnb.
Some of the features that I had in mind are,
- Listing all supported coins price, market cap, and volume and market-related data.
- Display coin prices in a chart with a time filter and brushing capability to select a time range.
But here I will be focusing on the second point above.
For this project, I will be using,
- reactjs with typescript
- visx for visualization
- styled-component for styling
- coingecko api
- material-ui for ui components.
- and other libraries.
Step 1 - Initialize project
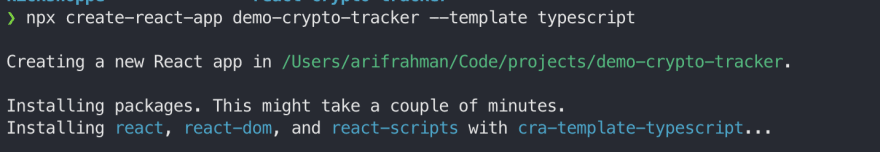
First off let start with creating our react project using create-react-app. If u haven't install create react app globally, you can do so in the cli with npm install -g create-react-app. We will be using typescript in our react project by using npx create-react-app <name of your project name> --template typescript.
If you haven't used typescript before, in a nutshell, this language allows us to use our Javascript skills more effectively. In fact, after you compile your code, all the Typescript stuff goes away and produces clean, cross-platform safe Javascript code. On top of being interoperable, Typescript adds unique features, including static typing, interfaces, classes, and more.
Next cd <name of your project> and install all the initial dependencies.
npm i axios axios-hooks @material-ui/core @material-ui/lab use-query-params @visx/axis @visx/brush @visx/gradient @visx/group @visx/shape @visx/tooltip d3-array date-fns numeral -f && npm i -D @types/styled-components @types/numeral @types/d3-arrayAs u can see in the dependencies, for Visx packages, we're only installing necessary packages that we need for our project as to not bloat our bundle size.
Next, let's start with structuring our project.
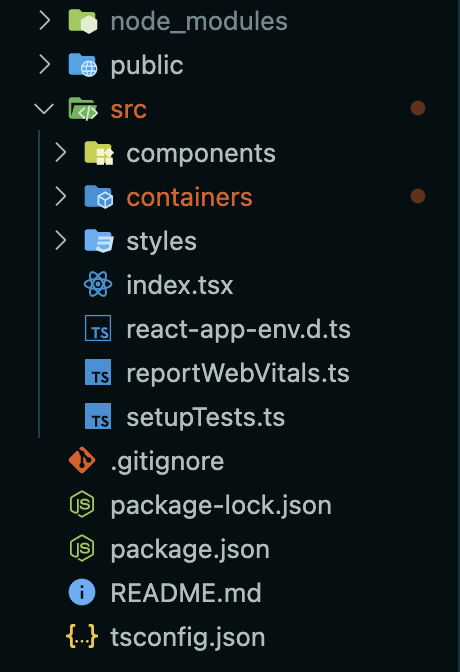
Let's add "baseUrl": "src" in our root tsconfig.json for absolute import. More about absolute import here.

Step - Writing our Initial Code
We'll be creating a container src/containers/Market/index.tsx for API integration. Next, we will use useAxios for calling our coin market chart endpoint.
To display our prices in our chart, we will be using /coins/{ids}/market_chart for getting historical market data to include price, market cap, and 24h volume in our chart. https://www.coingecko.com/api/documentations/v3#/

Let's write our initial code first:
// src/containers/Market/index.tsximport React from "react";import useAxios from "axios-hooks";import { TimeFilters } from "enums/TimeFilters";export type TimeStamp = number;export type Price = number;export interface GetMarketChartResponse { prices?: [TimeStamp, Price][];}const MARKET_CHART_ID = "bitcoin";const Market = () => { const [timeFilter, setTimeFilter] = React.useState<string>(TimeFilters.P1D); const [{ data, loading, error }] = useAxios<GetMarketChartResponse | null>({ url: `https://api.coingecko.com/api/v3/coins/${MARKET_CHART_ID}/market_chart?vs_currency=usd&days=${timeFilter}`, method: "GET", }); return <div>{JSON.stringify(data.prices)}</div>;};export default Market;Let's mapped our price data for use to pass on to our charts later on. Prices data return an array of an array with the 0 indexes of timestamp and 1 index of the price value. We're converting our date timestamp to Date object to be pass in our secondary chart later on.
const mappedData: DataProps[] = React.useMemo(() => { return data?.prices ? data.prices.map((ele) => ({ date: new Date(ele[0]), price: ele[1], })) : []; }, [data]);Before we move on to the next step. There are 3 main components that we want to develop.
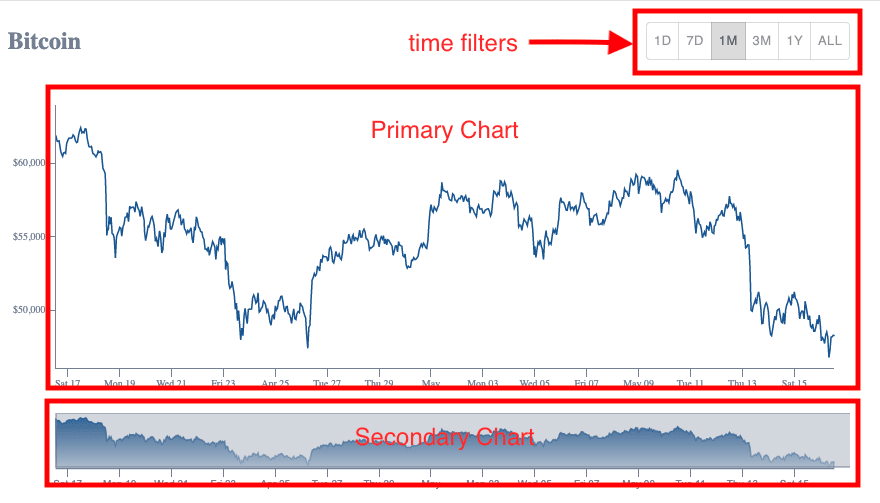
- Primary Chart - Display line chart, prices, date, and tooltip.
- Secondary Chart - Display area chart, brush capability for highlighting specific time range.
- Time filter Buttons - Allow us to filter on a specific time period e.g (past 1 month)
The overall IO will be:
- data prices will be passed down to our secondary chart.
- Set the initial highlight time range and set our filtered data for our primary chart
- Changing the highlighted secondary will update the primary chart.
- Changing the time filter button will fetch the latest price data.
- Hover on the primary chart on a specific point will display the date and price value.
Step - Building our Primary Chart
Let's create a primary chart component and interfaces.
// src/interfaces/DataProps.tsexport interface DataProps { date: string | Date; price: number;}// src/components/PrimaryChart/interfaces.tsimport { DataProps } from "interfaces/DataProps";export interface PrimaryChartProps { data: DataProps[]; width: number; height: number; margin?: { top: number; right: number; bottom: number; left: number };}export type TooltipData = DataProps;// src/components/PrimaryChart/index.tsx/* eslint-disable react-hooks/rules-of-hooks */import React from "react";import { PrimaryChartProps } from "./interfaces";const PrimaryChart: React.FC<PrimaryChartProps> = ({ data, width, height, margin = { top: 0, right: 0, bottom: 0, left: 0 },}) => { // bounds const xMax = Math.max(width - margin.left - margin.right, 0); const yMax = Math.max(height - margin.top - margin.bottom, 0); return ( <div style={{ position: "relative", margin: "0 0 1rem" }}> <svg width={width} height={height}> {/* we will include line chart, and tooltip */} </svg> </div> );};export default PrimaryChart;Our primary chart would require data for scaling, display X-axis date, Y-axis price value, and tooltip later on. We're passing height and weight to specify the box size for our svg to control the rest of our element.
Now let's create a reusable Line Chart for us to render in our primary chart.
// src/components/LineChart/index.tsximport React from "react";import { LinePath } from "@visx/shape";import { Group } from "@visx/group";import { AxisLeft, AxisBottom } from "@visx/axis";import { LineChartProps } from "./interfaces";import { DataProps } from "interfaces/DataProps";import { AXIS_COLOR, AXIS_BOTTOM_TICK_LABEL_PROPS, AXIS_LEFT_TICK_LABEL_PROPS,} from "./constants";const LineChart: React.FC<LineChartProps> = ({ data, width, yMax, margin, xScale, yScale, hideBottomAxis = false, hideLeftAxis = false, stroke, top, left, yTickFormat, children,}) => { if (!data) return null; // accessors const getDate = (d: DataProps) => new Date(d?.date); const getStockValue = (d: DataProps) => d?.price; return ( <Group left={left || margin.left} top={top || margin.top}> <LinePath<DataProps> data={data} x={(d) => xScale(getDate(d)) || 0} y={(d) => yScale(getStockValue(d)) || 0} strokeWidth={1.5} stroke={stroke} /> {!hideBottomAxis && ( <AxisBottom top={yMax + margin.top} scale={xScale} numTicks={width > 520 ? 10 : 5} stroke={AXIS_COLOR} tickStroke={AXIS_COLOR} tickLabelProps={() => AXIS_BOTTOM_TICK_LABEL_PROPS} /> )} {!hideLeftAxis && ( <AxisLeft scale={yScale} numTicks={5} stroke={AXIS_COLOR} tickStroke={AXIS_COLOR} tickLabelProps={() => AXIS_LEFT_TICK_LABEL_PROPS} tickFormat={(d) => { return yTickFormat ? yTickFormat(d) : d; }} /> )} {children} </Group> );};export default LineChart;We then import our newly create LineChart into our Primary Chart.
// src/components/PrimaryChart/index.tsx/* eslint-disable react-hooks/rules-of-hooks */import React, { useMemo } from "react";import numeral from "numeral";import { scaleLinear, scaleTime } from "@visx/scale";import { max, min, extent } from "d3-array";import { PrimaryChartProps } from "./interfaces";import { DataProps } from "interfaces/DataProps";import LineChart from "components/LineChart";import { theme } from "styles";// accessorsconst getDate = (d: DataProps) => new Date(d.date);const getStockValue = (d: DataProps) => d?.price;const PrimaryChart: React.FC<PrimaryChartProps> = ({ data, width = 10, height, margin = { top: 0, right: 0, bottom: 0, left: 0 },}) => { // bounds const xMax = Math.max(width - margin.left - margin.right, 0); const yMax = Math.max(height - margin.top - margin.bottom, 0); // scales const dateScale = useMemo(() => { return scaleTime({ range: [0, xMax], domain: extent(data, getDate) as [Date, Date], }); }, [xMax, data]); const priceScale = useMemo(() => { return scaleLinear({ range: [yMax + margin.top, margin.top], domain: [min(data, getStockValue) || 0, max(data, getStockValue) || 0], nice: true, }); // }, [margin.top, yMax, data]); return ( <div style={{ position: "relative", margin: "0 0 1rem" }}> <svg width={width} height={height}> <LineChart data={data} width={width} margin={{ ...margin }} yMax={yMax} xScale={dateScale} yScale={priceScale} stroke={theme.colors.lapislazuli} yTickFormat={(d) => { return numeral(d).format(d <= 100 ? "$0.00" : "$0,0"); }} /> </svg> </div> );};export default PrimaryChart;2 keys thing we need to make our LineChart work, is that we need to scale data accordingly to our X and Y boxSize is scaleTime() & scaleLinear()
- scaleTime - allow us to construct a new time scale according to range and domain we provide.
- scaleLinear - allow us to construct a continuos scale according to the range and domain we provide.
We're also using React useMemo to only recompute the memoized value when one of the dependencies has changed. This optimization helps to avoid expensive calculations on every render.
// scales const dateScale = useMemo(() => { return scaleTime({ range: [0, xMax], domain: extent(data, getDate) as [Date, Date], }); }, [xMax, data]); const priceScale = useMemo(() => { return scaleLinear({ range: [yMax + margin.top, margin.top], domain: [min(data, getStockValue) || 0, max(data, getStockValue) || 0], nice: true, }); // }, [margin.top, yMax, data]);Weewwww , that was a lot of code we just wrote! Let have a quick cup of and watch some .

Next, let's integrate logic for displaying our tool in our primary chart while hovering on a specific point in the chart. We will be using a tooltip hook helper from @visx/tooltip.
import { useTooltip, TooltipWithBounds, defaultStyles as defaultToopTipStyles,} from "@visx/tooltip";Then in our primary chart, useTooltip exposes function and variable we need to handle the value and position of our tooltip while hovering.
const PrimaryChart: React.FC<PrimaryChartProps> = ({ data, width = 10, height, margin = { top: 0, right: 0, bottom: 0, left: 0 },}) => { const { showTooltip, hideTooltip, tooltipData, tooltipTop = 0, tooltipLeft = 0, } = useTooltip<DataProps>();Now in the next line, let's include our function to handle tooltip position and setting the value.
// tooltip handler const handleTooltip = useCallback( ( event: React.TouchEvent<SVGRectElement> | React.MouseEvent<SVGRectElement> ) => { const { x } = localPoint(event) || { x: 0 }; const currX = x - margin.left; const x0 = dateScale.invert(currX); const index = bisectDate(data, x0, 1); const d0 = data[index - 1]; const d1 = data[index]; let d = d0; // calculate the cursor position and convert where to position the tooltip box. if (d1 && getDate(d1)) { d = x0.valueOf() - getDate(d0).valueOf() > getDate(d1).valueOf() - x0.valueOf() ? d1 : d0; } // we setting the position and value to be display later in our tooltip component below showTooltip({ tooltipData: d, tooltipLeft: x, tooltipTop: priceScale(getStockValue(d)), }); }, [showTooltip, priceScale, dateScale, data, margin.left] );But in order for us to get the touchpoint and data values in our chart, We need a component that allows us to track the mouse cursor touchpoint. Let's include Bar component from Visx that allows us to do just so.
{/* a transparent ele that track the pointer event, allow us to display tooltup */} <Bar x={margin.left} y={margin.top * 2} width={xMax} height={yMax} fill="transparent" rx={14} onTouchStart={handleTooltip} onTouchMove={handleTooltip} onMouseMove={handleTooltip} onMouseLeave={() => hideTooltip()} />There are 3 main components we would want to display
- Line to be drawn on the vertical of a specific point
- A circle element to indicate data point
- Tooltip box for displaying our date and price value.
Now let's include these lines of code!
// src/components/PrimaryChart/index.tsx/* eslint-disable react-hooks/rules-of-hooks */import React, { useMemo, useCallback } from "react";import { format } from "date-fns";import numeral from "numeral";import { useTooltip, TooltipWithBounds, defaultStyles as defaultToopTipStyles,} from "@visx/tooltip";import { scaleLinear, scaleTime } from "@visx/scale";import { localPoint } from "@visx/event";import { Line, Bar } from "@visx/shape";import { max, min, extent, bisector } from "d3-array";import { PrimaryChartProps } from "./interfaces";import { DataProps } from "interfaces/DataProps";import LineChart from "components/LineChart";import { theme } from "styles";// accessorsconst getDate = (d: DataProps) => new Date(d.date);const getStockValue = (d: DataProps) => d?.price;const getFormatValue = (d: DataProps) => numeral(d.price).format("$0,0.00");const bisectDate = bisector<DataProps, Date>((d) => new Date(d.date)).left;const PrimaryChart: React.FC<PrimaryChartProps> = ({ data, width = 10, height, margin = { top: 0, right: 0, bottom: 0, left: 0 },}) => { const { showTooltip, hideTooltip, tooltipData, tooltipTop = 0, tooltipLeft = 0, } = useTooltip<DataProps>(); // bounds const xMax = Math.max(width - margin.left - margin.right, 0); const yMax = Math.max(height - margin.top - margin.bottom, 0); // scales const dateScale = useMemo(() => { return scaleTime({ range: [0, xMax], domain: extent(data, getDate) as [Date, Date], }); }, [xMax, data]); const priceScale = useMemo(() => { return scaleLinear({ range: [yMax + margin.top, margin.top], domain: [min(data, getStockValue) || 0, max(data, getStockValue) || 0], nice: true, }); // }, [margin.top, yMax, data]); // tooltip handler const handleTooltip = useCallback( ( event: React.TouchEvent<SVGRectElement> | React.MouseEvent<SVGRectElement> ) => { const { x } = localPoint(event) || { x: 0 }; const currX = x - margin.left; const x0 = dateScale.invert(currX); const index = bisectDate(data, x0, 1); const d0 = data[index - 1]; const d1 = data[index]; let d = d0; // calculate the cursor position and convert where to position the tooltip box. if (d1 && getDate(d1)) { d = x0.valueOf() - getDate(d0).valueOf() > getDate(d1).valueOf() - x0.valueOf() ? d1 : d0; } showTooltip({ tooltipData: d, tooltipLeft: x, tooltipTop: priceScale(getStockValue(d)), }); }, [showTooltip, priceScale, dateScale, data, margin.left] ); return ( <div style={{ position: "relative", margin: "0 0 1rem" }}> <svg width={width} height={height}> <LineChart data={data} width={width} margin={{ ...margin }} yMax={yMax} xScale={dateScale} yScale={priceScale} stroke={theme.colors.lapislazuli} xTickFormat={(d) => { return numeral(d).format(d <= 100 ? "$0.00" : "$0,0"); }} /> {/* a transparent ele that track the pointer event, allow us to display tooltup */} <Bar x={margin.left} y={margin.top * 2} width={xMax} height={yMax} fill="transparent" rx={14} onTouchStart={handleTooltip} onTouchMove={handleTooltip} onMouseMove={handleTooltip} onMouseLeave={() => hideTooltip()} /> {/* drawing the line and circle indicator to be display in cursor over a selected area */} {tooltipData && ( <g> <Line from={{ x: tooltipLeft, y: margin.top * 2 }} to={{ x: tooltipLeft, y: yMax + margin.top * 2 }} stroke={theme.colors.primary} strokeWidth={2} opacity={0.5} pointerEvents="none" strokeDasharray="5,2" /> <circle cx={tooltipLeft} cy={tooltipTop + 1 + margin.top} r={4} fill="black" fillOpacity={0.1} stroke="black" strokeOpacity={0.1} strokeWidth={2} pointerEvents="none" /> <circle cx={tooltipLeft} cy={tooltipTop + margin.top} r={4} fill={theme.colors.lapislazuli} stroke="white" strokeWidth={2} pointerEvents="none" /> </g> )} </svg> {/* To display the tooltip box with price and value */} {tooltipData && ( <div> <TooltipWithBounds key={Math.random()} top={tooltipTop - 12} left={tooltipLeft} style={{ ...defaultToopTipStyles, background: theme.colors.lapislazuli, padding: "0.5rem", border: "1px solid white", color: "white", }} > <ul style={{ padding: "0", margin: "0", listStyle: "none" }}> <li style={{ paddingBottom: "0.25rem" }}> <b>{format(getDate(tooltipData), "PPpp")}</b> </li> <li> Price: <b>{`${getFormatValue(tooltipData)}`}</b> </li> </ul> </TooltipWithBounds> </div> )} </div> );};export default PrimaryChart;Before we can test, let's include our Primary Chart in our Market Container and pass our mappedData to our primary chart.
// src/containers/Market/index.tsxconst Market = () => { const [timeFilter, setTimeFilter] = React.useState<string>(TimeFilters.P1D); const [{ data, loading, error }] = useAxios<GetMarketChartResponse | null>({ url: `https://api.coingecko.com/api/v3/coins/${MARKET_CHART_ID}/market_chart?vs_currency=usd&days=${timeFilter}`, method: "GET", }); const mappedData: DataProps[] = React.useMemo(() => { return data?.prices ? data.prices.map((ele) => ({ date: new Date(ele[0]), price: ele[1], })) : []; }, [data]); return ( <> {mappedData?.length ? ( <> <PrimaryChart data={mappedData} height={200} width={600} margin={{ top: 16, right: 16, bottom: 40, left: 48, }} /> </> ) : null} </> );};Now try hovering our PrimaryChart!

Congratz! we have successfully displayed our first chart will a tooltip!
Let's wrap up
For the rest of the implementation, you can have a look at my open source project here: react-crypto-tracker.
It's been a fun project to build while learning through all the required tools/libraries to make this works. There a high learning curve to learn Visx but it all worth it!
If you like my blog please support me by giving my project . You can reach me out at LinkedIn. And again thank you for reading and stay safe you unicorn !

Original Link: https://dev.to/ayeprahman/how-i-build-crypto-tracker-chart-with-react-4k9h
Dev To
More About this Source Visit Dev To