
An Interest In:
Web News this Week
- April 18, 2024
- April 17, 2024
- April 16, 2024
- April 15, 2024
- April 14, 2024
- April 13, 2024
- April 12, 2024
Some of Our Sources
- Mashable
- TutsPlus - Code
- Just Creative
- Spoon Graphics
- Vandelay Design
- FanExtra - PSD
- Crazy Leaf Design
- Reencoded
- Specky Boy
- Freelance Switch
Help Webnuz
Referal links:
Level up your JavaScript browser logs with these console.log() tips
I consider myself a backend software engineer - and as any backend engineer would attest, a large part of our life is spent monitoring, troubleshooting, and debugging our applications. The fundamental rule of software development is that software will fail - what separates new developers from experienced ones is how they plan for those failures. Robust and effective logging is an important part of planning for failure, and eventual mitigation. As it is for backend development, logging can be useful for frontend software development, but it goes much further than just troubleshooting and debugging. Effective frontend logging can also make the development experience productive, fast, and fun.
While Im a big proponent and diligent practitioner of Test-driven development, I love the flexibility, the richness of information, and code confidence browsers provide to frontend developers who make effective use of console.log(). I thought Id share some frontend logging tips and tricks Ive learned and incorporated in my workflow over time while building Firecode.io - in the hope that some of these will help you make your development workflow a bit more productive and fun!
I like to divide these tips into two broad categories - quick n dirty logging for when youre actively building and debugging your application, and durable production logging - to know when your apps working as expected and when its not.
Tips for quick n dirty development logging with console.log()
Dont use console.log().
Yes, thats right. I dont use console.log(). Well, ok I write wrappers that use console.log() (more on that in the production logging section), but if you want to log something in your app to see whats going on, use console.trace() instead. In addition to giving you everything console.log() does, it also outputs the entire stack trace so you know where exactly the message is emitted from.

Use ES6s computed property names to identify your objects and avoid variable name confusion
This one is straightforward - use ES6s computed property syntax and wrap the objects you wish to log in curly braces inside console.log() - i.e. use console.log({user}) vs console.log(user). Youll find them neatly logged with the variable name set as the key, and the value as the object itself. This is especially useful when youre in a hurry and want to log multiple objects in the same console.log() command.

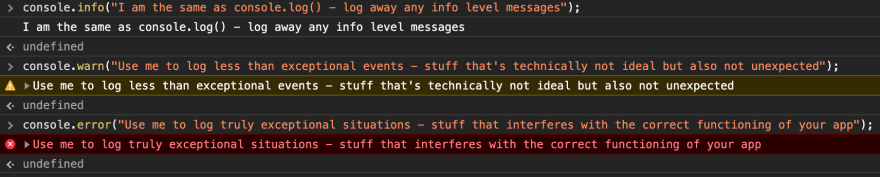
Embrace tiered log levels - error, warn, info
console.log(param) by default logs at the INFO level - however, you also have 3 other logging levels at your disposal which you should make use of - console.debug(), console.warn() and console.error(). Besides formatting differences (notice the different colors?), the browsers developer console also lets you easily filter out logs at different levels with a convenient dropdown to declutter your logs.

When logging lists of items, use console.table()
This one is self-explanatory and one of my favorite console functions - if you ever need to log a list of objects, give console.table() a try.

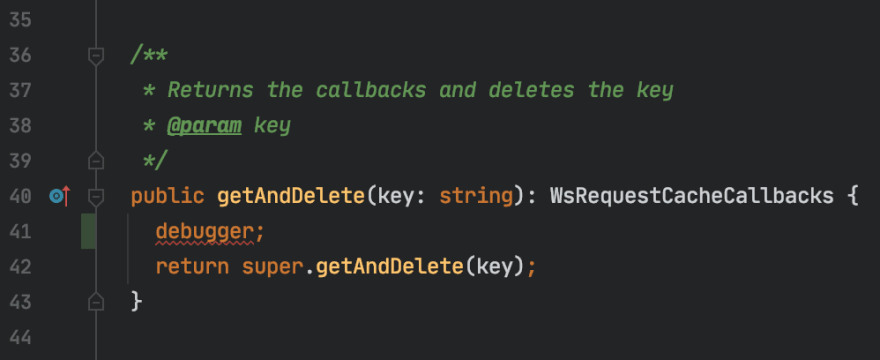
Quickly debug with debugger
Want to save a precious few seconds? Instead of finding your file in the developer console to add a breakpoint, drop a debugger in your code to halt execution when the line is executed. From this point on, you can debug and step over / into functions as you normally would.

Granular performance profiling with console.profile() and console.time()
Want to profile an exact user flow in your application to find hot spots? Trigger console.profile(profileName) at the start of the action, and console.profileEnd(profileName) at the end to inspect the CPU profile for the flow.


Related, you can measure exactly how long a flow takes with triggering console.time(id) at the start of the flow, and console.timeEnd(id) at the end.

Count labelled executions with console.count()
This ones one of those console functions I havent found much use for personally, but its there if you need it. console.count(label) can help you know exactly how many times a piece of code gets executed - which could be useful for finding and eliminating race conditions and other scenarios.

Prettify your logging with CSS
This is by far my favorite console feature and one I make extensive use of in production logging (more on this in the production logging section). You can make use of format strings to format your log messages. The %c is the placeholder for CSS styles, and anything after is your message.

You can also style multiple elements by extending your format string to include %s for string parameters.

Since Im a highly visual person, I like to spend some time making my info and debug logs look pretty and be useful at the same time. I make extensive use of this feature for production logging in Firecode.io - which is an excellent segue for the next section.

Production logging with console.log()
Getting frontend code production ready involves a number of steps - some being uglifying and compressing your code, generating cacheable asset digests, and removing console.log() s from your app. Why? Because you dont want your users to have to open the developer console to interact with your app, which nullifies the usefulness of your logs and leaves them as pure security holes for the more inquisitive to take advantage of. At the same time, when you use your own app, you most likely want the most granular level of logging to understand how your app is functioning and find and squash bugs. If your app is being used by others, youd also want to be notified when your applications users encounter errors so you can track down and fix your code. Heres a couple of things I do to satisfy these requirements as best one could on the frontend:
Dont use console.log()
Instead, write a wrapper class that includes logic for conditionally logging based on the log level based set on a global variable by the backend. Warning - youll see TypeScript code snippets ahead - if youre not familiar with TypeScript, think of it as a superset of JavaScript with types tacked on (gross over-simplification) - i.e. const str = some string; becomes const str: string = some string - types are added after a variable followed by a semicolon.
In the case of Firecode.io, I wrote my own frontend framework that utilizes RxJS, but includes familiar concepts such as components from other popular frameworks such as React and Vue - while adding additional concepts such as engines for processor-heavy code blocks, channels for WebSocket messages, and clients for HTTP requests. Visualizing all these pieces working together was critical, so I implemented custom formatting in a Logger wrapper class that formats and visually differentiates logs from each part of the application.

Instead of calling console.log("Cache SET to", {value}), I call Logger.debug(Cache set to, {value}, Framework.Cache) . The Logger class has a TypeScript enum that maps each framework component to the color to be used:

This allows me to visually focus on components of the app during development - for example, if I want to see what the WsRequestCache is doing I can tune out everything else besides the turquoise badged logs.
Protect your logs by having the backend set your log level
I have Firecode.io configured to turn on debug level logging by default for admin users with a JavaScript variable that is set by the backend. While adventurous users can still find and set these flags in the developer console to turn on granular logging, it is better than having all logs exposed to every user of your application by default, or having a post-processor remove all logging completely from your application in production.
Set in a Ruby on Rails view: const logLevel: number = <%= @app.get_log_level_for_user %>
And in the Logger class:
class Logger { ... ... static info(...) { shouldLog(Level.INFO) && console.log(...); ... }}Log and notify on actionable errors
Last but not least, you want to be notified when exceptional conditions are encountered by users without necessarily outputting logs to the developer console. You can do this by including a call to pipe your errors to a third party APM service such as AppSignal in your Loggers error function like so:
class Logger { ... ... static error(e) { if (shouldLog(Level.ERROR)) { console.error(e); } appsignal.sendError(e); }}AppSignal includes integrations to pipe your errors to outbound notifications services such as Slack, PagerDuty, and OpsGenie - you can even hook up a project management tool such as JIRA or Trello to automatically create issues and bugs for your team.
Summary
I really hope these tips and anecdotes make your frontend development experience a little more productive and fun! Ive obviously only touched the surface of logging ninjitsu in this post, so if you have any more tips to share Id love to read them over on my Twitter.

Two parting plugs - Im rebuilding Firecode.io from the ground up with a brand new set of coding interview questions for JavaScript, Java, Python, and Scala. If youre interested in coding interview prep, hit me up at @ackshaey or @firecodeio. If youre new to JavaScript and want to understand how object-oriented JavaScript and prototypal inheritance work under the hood, check out my favorite book on the subject - The Principles of Object-Oriented JavaScript, and if youre interested in learning more about why you should use TypeScript instead, check out Effective TypeScript.
Original Link: https://dev.to/ackshaey/level-up-your-javascript-browser-logs-with-these-console-log-tips-55o2
Dev To
More About this Source Visit Dev To