
An Interest In:
Web News this Week
- April 30, 2024
- April 29, 2024
- April 28, 2024
- April 27, 2024
- April 26, 2024
- April 25, 2024
- April 24, 2024
Some of Our Sources
- Technology Review
- Smashing Magazine
- Creative Curio
- Noupe
- CSS Globe
- Line 25
- Specky Boy
- Spyre Studios
- Web Resource Source
- The Verge
Help Webnuz
Referal links:
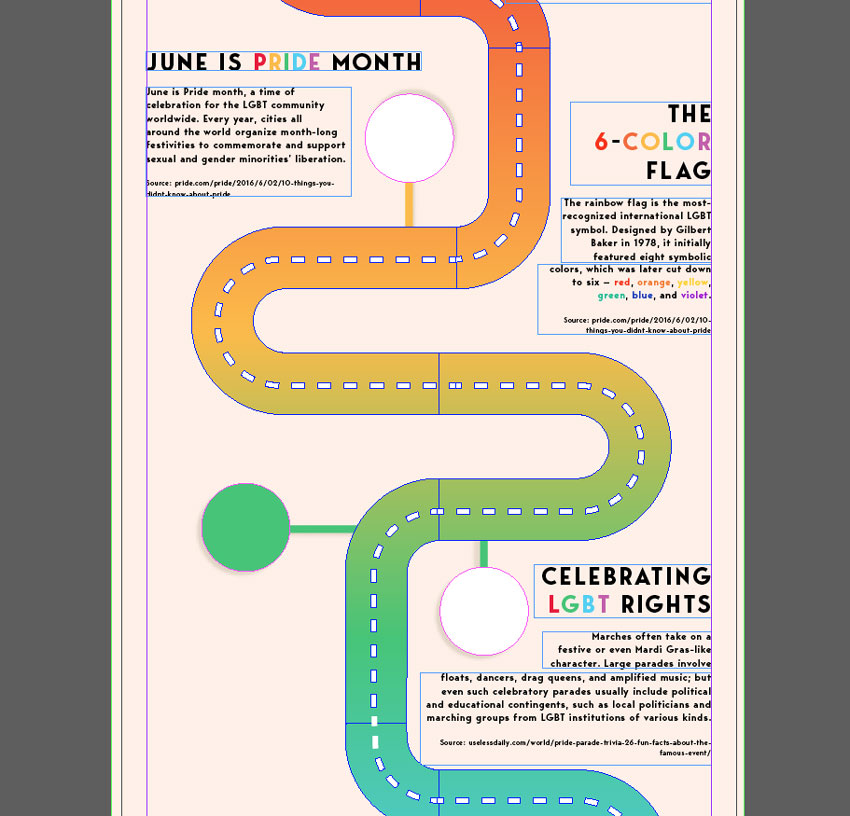
How to Create a Rainbow Road Infographic to Celebrate Pride Month

June is Pride Month, when people worldwide take a positive stance against discrimination and violence toward the LGBT community. As well as promoting equality, understanding and tolerance, Pride Month is also a time for celebration and joy.
To celebrate Pride Month here at Envato Tuts+, we’ve created an infographic using the theme of the Pride Marches, which you can recreate for yourself using InDesign and Illustrator. If you want more infographic practice, try this earlier tutorial:

This tutorial is aimed at beginner-to-intermediate users of InDesign, and it’s a great all-round introduction to creating infographic layouts.
Short on time? You can find easy-to-edit infographic templates on GraphicRiver and Envato Elements.

What You’ll Need to Create Your Infographic
We’ll use Adobe InDesign to create the main artwork for our infographic, and dip into Illustrator briefly to edit vector graphics for the design. You’ll also need to download the following images and font files:
Install the font files on your system, and you’re then ready to start designing.
1. How to Set Up Your Infographic Document in InDesign
Step 1
Open InDesign, and go to File > New > Document.
We’re going to size the infographic to an online-friendly size, but you can always reduce the width of the image as you need to later on.
Click on Web at the top of the New Document window, and set the Width of the page to 870 px and Height to 2600 px.
Then click Create.

Step 2
Expand the Layers panel (Window > Layers) and double-click on Layer 1. Rename it Background.
Choose New Layer from the panel’s drop-down menu. Name this layer Pointers and click OK.
Repeat to create three more layers in this order: Road, Icons, and finally Type.
Then lock all the layers except Background, which we’ll work on first.

Step 3
Expand the Swatches panel (Window > Color > Swatches) and choose New Color Swatch from the panel’s menu.
With the Color Mode set to RGB, adjust the levels to R=254 G=240 B=231, and click Add and then OK.

Use the Rectangle Tool (M) to create a shape across the whole page, setting the Fill to your new swatch, R=254 G=240 B=231.

2. How to Create Your Rainbow Road
Step 1
Minimize the InDesign window for now, and open up the street vector illustration in Illustrator.
Select the road graphic in the center, and Right-Click > Ungroup, separating the dashed lines from the main body of the road behind.

We want to join the individual sections of the road together, but to do this smoothly, we first have to make sure each section aligns to each other perfectly.

Take the Direct Selection Tool (A) and select individual anchor points at the top of each section of road which overlap another. Use the arrow keys to adjust their position so they meet the other anchor points neatly.


Step 2
Once you’ve finished aligning the sections, select all the central road sections (excluding the small outlying roads leading to the houses), and Edit > Copy them.

Head back over to your InDesign document and lock the Background layer. Unlock the Road layer. Then Edit > Paste the vector road directly onto this layer. Position towards the top of the page, centrally, as shown below.

Step 3
Select only the lower four sections of the road, and Edit > Copy.

Edit > Paste, and then Right-Click on the copy and Transform > Flip Horizontal.

Position this overlapping the top section, as shown below.

Step 4
Switch to the Direct Selection Tool (A) and use this to select the anchor points on the overlapping section, moving them so that they meet each section perfectly, as we did earlier in Illustrator.

When the sections are aligned, select all the sections of the road across the whole page, and go to Object > Paths > Make Compound Path.


Step 5
Choose New Color Swatch from the Swatches panel, and create six new RGB swatches:
- R=237 G=83 B=86
- R=245 G=107 B=53
- R=253 G=188 B=61
- R=64 G=197 B=117
- R=75 G=207 B=245
- R=196 G=93 B=172

Step 6
Then choose New Gradient Swatch from the Swatches panel.

Name the swatch Rainbow Road Gradient, and set the Type to Linear and Stop Color to Swatches.
Choose the red swatch, R=237 G=83 B=86, for the left-hand stop, and violet, R=196 G=93 B=172, for the right-hand swatch. Click on the Gradient Ramp to add more stops, graduating the color from your swatches to create a rainbow effect.
Then click Add and OK.

Step 7
Select the road and apply the Rainbow Road Gradient swatch to the Fill of the vector.

From the Gradient panel (Window > Color > Gradient), you can adjust the Angle of the gradient, so that the color moves from red at the top towards violet at the bottom.

Step 8
Head back over to Illustrator and the street vector for a moment.
Select the dashed line running along the center of the road, and Edit > Copy it.

Head back to your InDesign document and Edit > Paste it onto the Road layer. Scale and position it to match the top section of road.

Edit > Paste it again, and Right-Click > Transform > Flip Horizontal. Manoeuvre it into position over the lower half of the road.


3. How to Format Typography for Your Infographic
Step 1
Lock the Road layer and unlock the Type layer at the top.

Take the Rectangle Tool (M) and drag across the top of the page, setting the Fill to [Black].

With the shape selected, go to Object > Effects > Drop Shadow. With the Angle set to around 90 Degrees, bring the Opacity of the shadow down to 20%. Click OK to exit.

If you want to add space for a credit at the bottom of the infographic, you can create another rectangle with a [Paper] Fill.

Step 2
Create a text frame using the Type Tool (T) at the top of the page, typing in ‘ON THE MARCH TO CELEBRATE’.

From either the top Controls panel or the Character and Paragraph panels (Window > Type & Tables > Character / Paragraph), set the Font to Bergen Sans Semi Bold, Size 24 pt and Align Center.
From the Swatches panel, set the Font Color to [Paper].
Add two more text frames below this, typing in ‘PRIDE’ in the first, and changing the font weight to Bold and Font Size to 120 pt. Write up the date in the text frame below.

Apply your RGB swatches to the individual letters of ‘PRIDE’, to create a rainbow effect.

Step 3
You can add pop-out pointers to the road to mark good places for adding text to your infographic.
To create a pointer, take the Line Tool (\) and, holding Shift, drag to create a short line extending from the road. From the Stroke panel (Window > Stroke), increase the Weight of the stroke to 11 pt.
From the Swatches panel, choose the matching RGB swatch to apply to the Stroke Color of the line.

Use the Ellipse Tool (L) to create a circle shape 125 px in diameter (you can see this up in the top Controls panel), and set the Fill Color to [Paper].

Right-Click > Group the line and circle together.

Then go to Object > Effects > Drop Shadow. Bring the Opacity down to 10%, and click OK.

Step 4
Copy and Paste the pointer, and position the copies intermittently along the road.
Right-Click > Transform > Rotate some of the pointers, and you can adjust the Stroke Color of the lines and Fill Color of the circles to match the color of the road as you move down the page.

Step 5
Use the Type Tool (T) to create a text frame next to one of the pointers. Type in a subtitle and set the Font to Bergen Sans Bold, All Caps, Size 34 pt.

Create a second text frame below for smaller body text, setting this in Bergen Sans Semi Bold, Size 14 pt.

You can use this pair of text frames as a template for filling up the infographic with more text. Copy and Paste the pair and move these next to some of the other pointers.


Step 6
You can set pull-out statistics in other text frames, setting the Font to Bergen Sans Semi Bold, Size 23 pt and in All Caps.


You can also place number statistics in some of the pointer circles, setting the Font to Bergen Sans Bold, Size 110 pt.


4. How to Add Icons to Your Infographic
Step 1
Open up the LGBT icons set in Illustrator.
From here, you can select individual icons and Edit > Copy them.

Back in your InDesign document, lock the Type layer and unlock the Icons layer.
Edit > Paste the icon directly onto the page, and size it to fit over one of the pointer circles, as shown below.

Keep heading back to Illustrator and copying icons, before pasting them into your InDesign document.


Step 2
You can also add some icons on top of the road. To add a slight 3D effect to these, go to Object > Effects > Drop Shadow and add a 20% Opacity shadow.

Continue to build up icons across your design, choosing images which fit well with your text.


You can paste in a flag from the icons set onto the Pointers layer, so that it sits below the road, creating a 3D effect.

5. How to Export Your Finished Infographic
When you’ve built up text and icons across your infographic and have done a quick spellcheck (Edit > Spelling > Check Spelling), you’re ready to export your design ready for sharing online.
Go to File > Export, give your file a name, and choose either JPEG or PNG for a social-media-friendly image. Click Save.

If you’ve chosen PNG, follow the default options in the window that opens.
For JPEG, set the Resolution to 72 ppi in the Export JPEG window. Click Export to create your image.

And you’re done! Great job!
Conclusion: Your Finished Infographic
Your Pride infographic is finished and ready for uploading online—awesome work!
Make sure to share this infographic on social media or pin up a copy at work or on your community noticeboard, to spread awareness about Pride Month and get everyone into the party spirit!
You can find more infographic templates and icons to use on your designs over on GraphicRiver and Envato Elements.

Original Link:
TutsPlus - Design
More About this Source Visit TutsPlus - Design