An Interest In:
Web News this Week
- April 26, 2024
- April 25, 2024
- April 24, 2024
- April 23, 2024
- April 22, 2024
- April 21, 2024
- April 20, 2024
Some of Our Sources
- Smashing Magazine
- You The Designer
- Fuel Your Creativity
- Web Design Ledger
- Reencoded
- Line 25
- CSS Tricks
- Freelance Switch
- Codrops
- Android Headlines
Help Webnuz
Referal links:
May 10, 2018 06:33 pm PDT
Original Link: http://feeds.boingboing.net/~r/boingboing/iBag/~3/OEEGhr7ijtg/your-perception-of-this-graph.html
Your perception of this graph is a graph of your perception
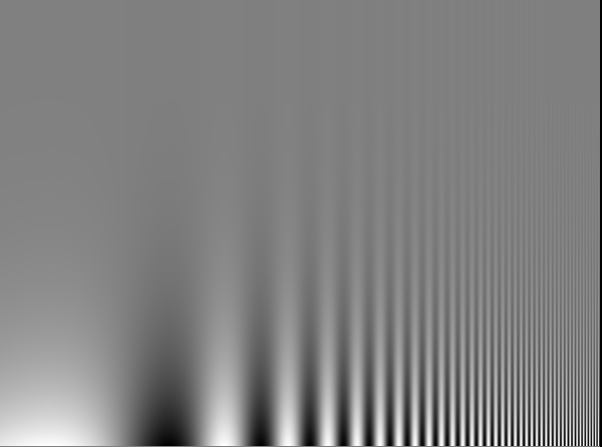
Spatial frequency means how often things change in space. High spatial frequency changes means lots of small detail. Spatial frequency is surprisingly important to our visual system lots of basic features of the visual world, like orientation or motion, are processed first according to which spatial frequency the information is available at...
Spatial frequency is also why, when youre flying over the ocean, you can see waves which appear not to move. Although your vision is sensitive enough to see the wave, the motion sensitive part of your visual system isnt as good at the fine spatial frequencies which creates a natural illusion of static waves.
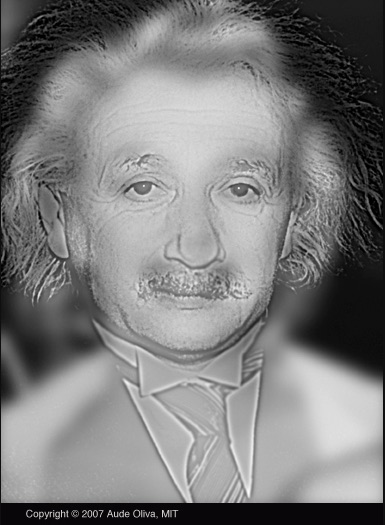
See Einstein below? Now go a few steps back from your screen and look again:
Original Link: http://feeds.boingboing.net/~r/boingboing/iBag/~3/OEEGhr7ijtg/your-perception-of-this-graph.html
Share this article:
Tweet

View Full Article