
An Interest In:
Web News this Week
- April 29, 2024
- April 28, 2024
- April 27, 2024
- April 26, 2024
- April 25, 2024
- April 24, 2024
- April 23, 2024
Some of Our Sources
- Team Treehouse
- Spoon Graphics
- Six Revisions
- Abduzeedo
- Vandelay Design
- Creative Curio
- Naldz Graphics
- Design Modo
- Daily Now
- The Verge
Help Webnuz
Referal links:
How to Make Flowcharts with Mermaid.js
Mermaid.js is a powerful JavaScript library that can build a variety of charts and diagrams from a specialized flavor of markdown. While Mermaid.js supports many common and uncommon types of charts, perhaps the most frequently used type of chart it supports is the lowly flowchart.
Flowcharts are simple and flexible charts that connect different shapes together with arrows to convey a visual picture.
 Flowcharts are often used to illustrate logical flows or decision-making processes and are frequently used in software engineering to show data or communication flows in software systems.
To show you what Mermaid.js can do with flowcharts, let's take a look at building out a simple flowchart illustrating a REST request that flows from the client to the server, is fulfilled by the database, and then returns back to the client.
Basic Flowcharts with Mermaid.js
We'll start first by creating a flowchart in markdown and defining the three shapes we'll want on our flowchart.
The markdown for this looks as follows:
flowchart Client Server DatabaseWhen rendered in a markdown viewer that supports Mermaid.js, this markdown displays the following diagram:

There are a growing number of places that support Mermaid.js diagrams including GitHub markdown, Polyglot Notebooks, and the Mermaid.js live editor. You can also import Mermaid.js to transform markdown on your webpage into diagrams.
Relationships in Mermaid.js
Because a flowchart without any relationship lines is fairly useless, let's see how Mermaid.js allows us to define relationships.
With Mermaid.js you simply define a relationship in markdown with --> between the two connected shapes and the diagram takes care of the rest.
Here's our flowchart with a pair of relationships:
flowchart Client --> Server Server --> Database
This is getting there, but most client / server communication diagrams are arranged from left to right. Mermaid.js lets us make that tweak by stating flowchart LR:
flowchart LR Client --> Server Server --> Database![]() Great! Now we have the communications from the client to the server and from the server to the database, but it'd be nice to represent the responses as well.
Great! Now we have the communications from the client to the server and from the server to the database, but it'd be nice to represent the responses as well.
With Mermaid.js you can have multiple connections to each shape if it makes sense. Additionally, Mermaid.js has a variety of connector styles, including -.-> to represent a dotted arrow instead of a solid arrow.
flowchart LR Client --> Server Server --> Database Database -.-> Server Server -.-> Client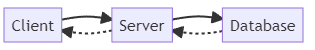 Now the communications are a lot more explicit, but it'd be nice to label the contents of each message.
Note: if your primary focus is communications between systems, you may want to check out using Mermaid.js for sequence diagrams. Alternatively, if your focus is the data, you should investigate entity relationship diagrams.
Mermaid.js allows you to provide text over each relationship line if you'd like by typing the text in the middle of the connector arrow.
Additionally, because Mermaid.js is very sensitive to inconsistent spelling, you may want to define your shapes at the beginning of a flowchart and give them an alias to reduce typing in your markdown.
The code below aliases the client as c, the server as s and the database as db. Additionally, each relationship is now given text to illustrate what flows between systems.
flowchart LR c[Client] s[Server] db[Database] c -- HTTP GET --> s s -- SQL Query --> db db -. Result Set .-> s s -. JSON .-> c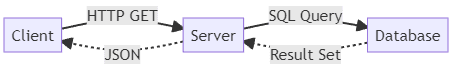 This diagram is now significantly more helpful and if we wanted to rename a shape, we only need to rename it in the line that defines the shape initially.
Customizing Mermaid.js Flowcharts
Additional Connector Types
Mermaid.js supports more than just solid and dashed arrows.
Below are a variety of connector types that Mermaid.js currently supports. Additionally, I have a line that shows you how you can define multiple relationships in a single line via chaining:
flowchart LR Base --> Arrow Base ==> Heavy Base -.-> Dotted Base --- Line Base --> You --> Can --> Chain --> Relations --> On --> One --- Line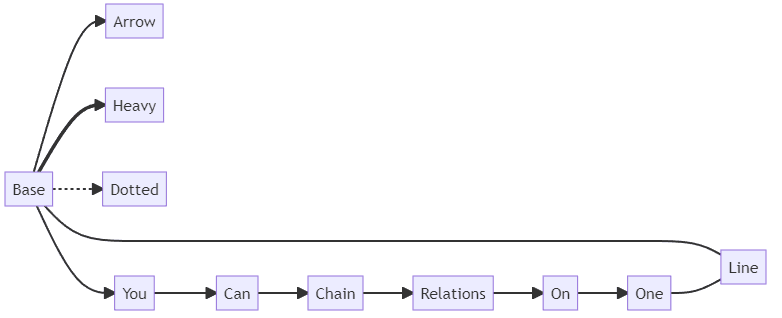 Note:
Note: Line is mentioned twice on the last two lines of the markdown which explains why there are two lines going to it.
Customizing Flowchart Shapes
Our client / server communication diagram looks pretty good, but most programmers I've worked with draw their databases as drums on diagrams.
Mermaid.js allows you to customize shapes if you'd like and helpfully includes a database shape via [(Name)] syntax.
The code below customizes the shape of the database element on its definition line:
flowchart LR c[Client] s[Server] db[(Database)] c -- HTTP GET --> s s -- SQL Query --> db db -. Result Set .-> s s -. JSON .-> c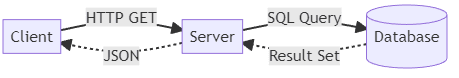 As you might expect from a flowchart library, Mermaid.js offers a large number of custom shapes including these below:
flowchart a[Default] b([Rounded]) c[(Database)] d[[Subroutine]] e((Circle)) f>Note] g{Decision} h{{Hexagon}} i[/Parallelogram/] j(((Double Circle)))
For a more complete list of shapes, I recommend you view the Mermaid.js flowchart documentation.
Managing Complexity with Subgraphs
While we already have a perfectly usable diagram, we could refine it further by illustrating where each part of our application is hosted.
In Mermaid.js you can add sections or groups to your flowcharts to visually group related elements.
Mermaid.js calls these groupings of elements "subgraphs" and allows you to define them by stating subgraph Graph Name to start the group and end to end it.
Here's our graph that illustrates that the client is hosted on Netlify and the server and database are running on Azure:
flowchart LR subgraph Azure s[Server] db[(Database)] end subgraph Netlify c[Client] end c -- HTTP GET --> s s -. JSON .-> c db -. Result Set .-> s s -- SQL Query --> db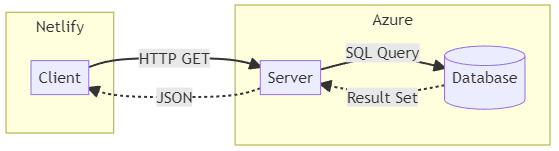
The diagram above makes this look easy, but I had to try a number of different ordering approaches until I got Mermaid.js to organize the groups the way I wanted to.
Once you use subgraphs, you will likely need to do some additional tweaks to help your diagram layout meet your needs.
Adding Icons with Font Awesome
Like Mermaid.js mind maps, flowcharts can use icons to improve their readability or visual appeal.
If you or the tool you are using have already imported Font Awesome, you can specify an icon for each shape via the fa: prefix and then the name of your icon as shown below:
flowchart LR subgraph Azure s[fa:fa-code Server] db[(fa:fa-table Database)] end subgraph Netlify c[fa:fa-user Client] end subgraph Netlify end subgraph Azure direction LR end c -- HTTP GET --> s s -- SQL Query --> db db -. Result Set .-> s s -. JSON .-> c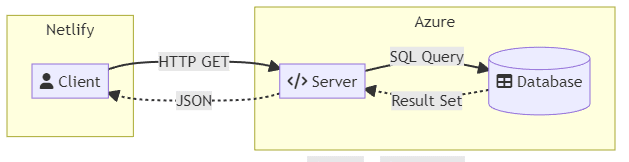
While I don't view these icons as particularly helpful in the above example, I certainly could see other diagramming cases that could benefit from adding iconography.
Closing Thoughts
Mermaid.js flowcharts are simple, functional, and efficient.
Beyond helping you generate visuals, one of the key advantages of Mermaid.js flowcharts is that they are easy to embed in markdown documents as raw markdown. This lets others see your diagrams and easily make additions or corrections as systems inevitably change.
Finally, since these diagrams are stored as markdown, they are trivially easy to store in a version control system.
I personally plan on using Mermaid.js flowcharts for quick high level system architecture diagrams going forward. They may not have the full visual polish that you might want for something in a formal presentation, but they are simple, accessible, and powerful.
Original Link: https://dev.to/integerman/how-to-make-flowcharts-with-mermaidjs-1ooo
Dev To
More About this Source Visit Dev To