
An Interest In:
Web News this Week
- April 27, 2024
- April 26, 2024
- April 25, 2024
- April 24, 2024
- April 23, 2024
- April 22, 2024
- April 21, 2024
Some of Our Sources
- BoingBoing
- Mashable
- Techcrunch
- Simplebits
- Team Treehouse
- Six Revisions
- Abduzeedo
- Web Design Ledger
- Android Headlines
- TechPowerUp
Help Webnuz
Referal links:
Profiling Machine Learning Using Graphsignal
Graphsignal is a machine learning profiler that helps data scientists and ML engineers understand, benchmark and analyze model training and inference to make it faster and computationally efficient.
By adding a few lines of code to machine learning notebooks, scripts or applications, Graphsignal automatically profiles TensorFlow, Keras, PyTorch, Hugging Face and other frameworks.
To add the profiler, simply install and import the Python module and configure it by providing an API key and workload name. Get the API key by signing up for a free account. Finally, register the profiler callback or use profile functions depending on the framework.
Here is a minimal example for Keras framework:
# 1. Import Graphsignal modulesimport graphsignalfrom graphsignal.profilers.keras import GraphsignalCallback# 2. Configuregraphsignal.configure(api_key='my_key', workload_name='training_example')....# 3. Add profiler callbackmodel.fit(..., callbacks=[GraphsignalCallback()])You can find more information on other integrations in the Docs.
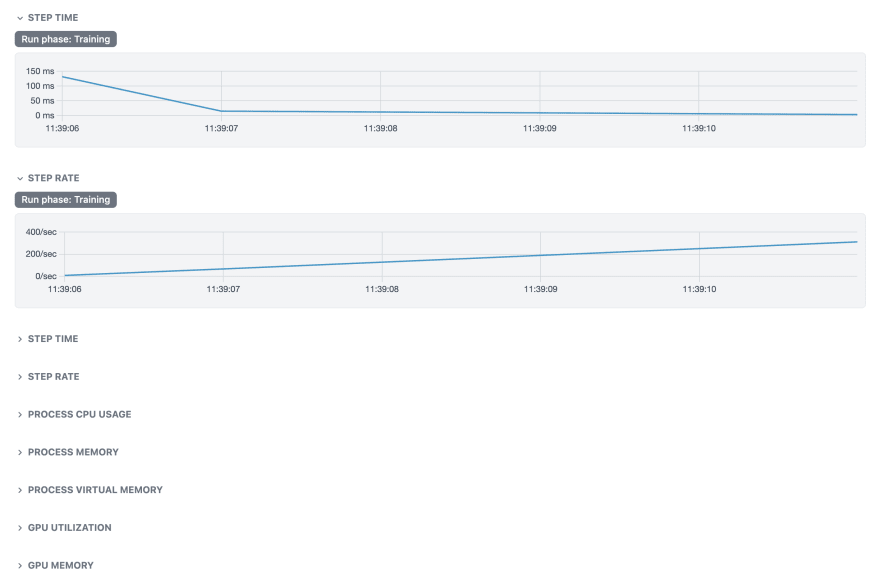
After starting the run, the profiles are automatically recorded and available for analysis in the cloud dashboard for each run or experiment, where some basic statistics, such as batch time, batch rate, GPU memory and utilization, can be compared.
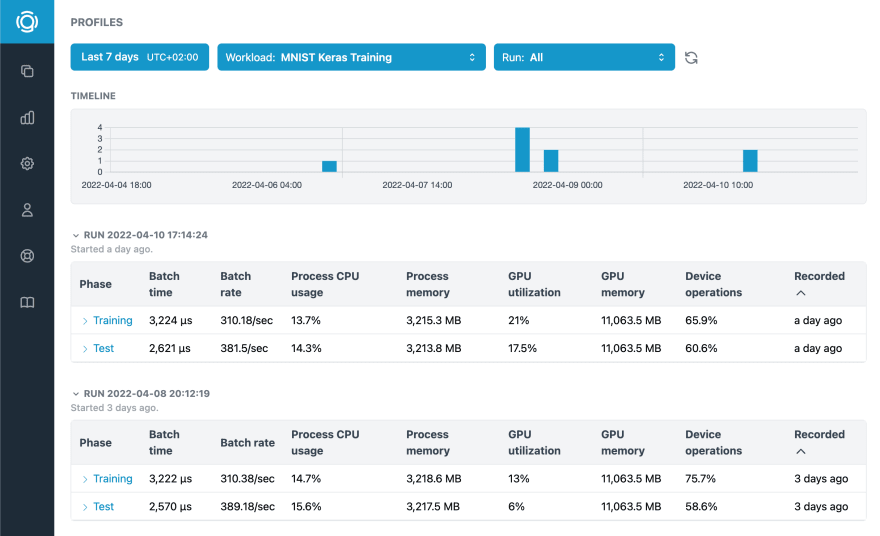
Opening a profile allows you to see much more detailed information about a particular phase of the run.
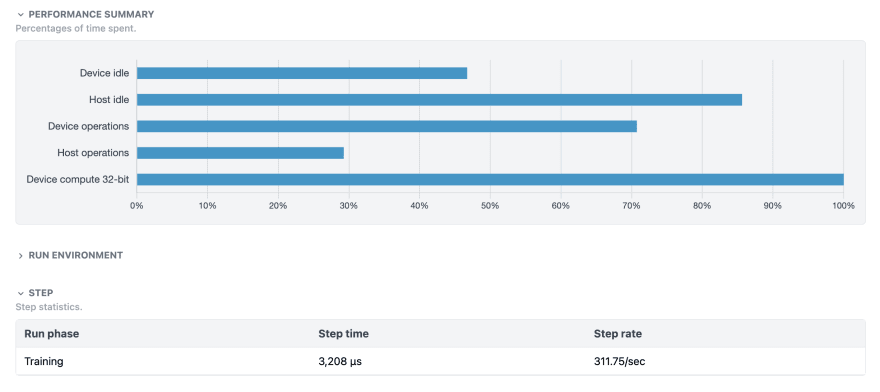
A profile includes a performance summary, detailed information about the run environment, training or inference speed:
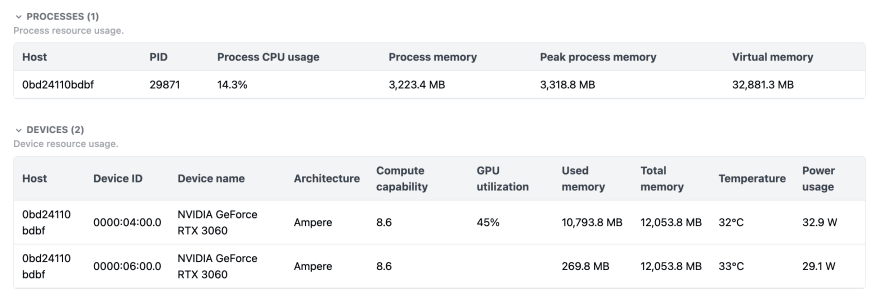
Compute resources utilization:
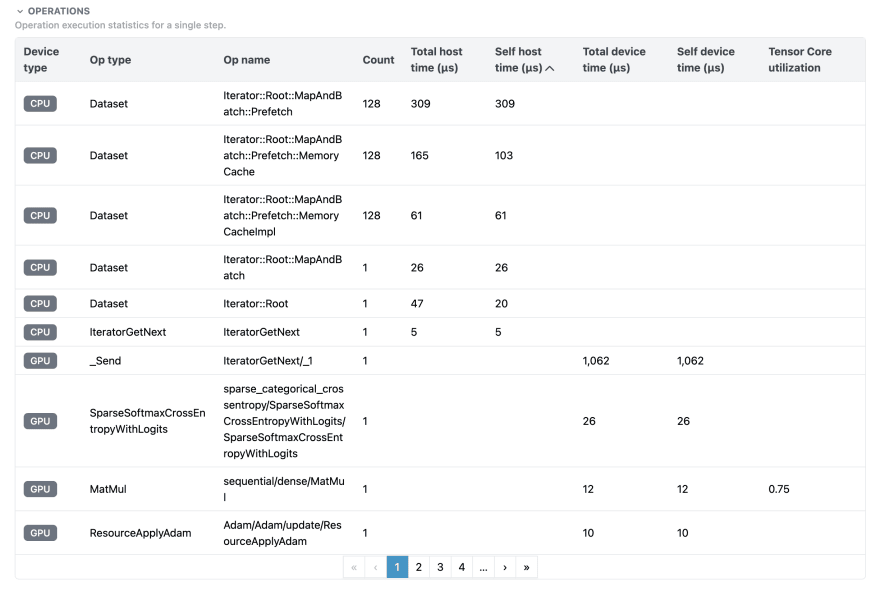
Also, operation and kernel level statistics, which are instrumental for understanding where exactly the most time and compute are spent. For example, in this case, we can see that most of the time is spent on data input operations, so optimizing those may result in significant speed gains.
To see how runs perform over time, use Metrics dashboard.
Add Graphsignal to all your ML workloads that are run manually or executed periodically in ML pipelines, and enable constant team access to automatically recorded profiles and metrics at any time.
As you have seen, trying it out is easy, see Quick Start Guide for instructions or learn more at graphsignal.com.
Original Link: https://dev.to/dmelikyan/profiling-machine-learning-using-graphsignal-1aao
Dev To
More About this Source Visit Dev To