
An Interest In:
Web News this Week
- April 27, 2024
- April 26, 2024
- April 25, 2024
- April 24, 2024
- April 23, 2024
- April 22, 2024
- April 21, 2024
Some of Our Sources
- TutsPlus - Code
- Joshua Blankenship
- Six Revisions
- Abduzeedo
- Vandelay Design
- Inspiredology
- Naldz Graphics
- 24 Ways
- Willems Lab
- Hashedout
Help Webnuz
Referal links:
Model evaluation - MAP@K
TLDR
In this Mage Academy lesson, well be going over how to evaluate ranking models built for recommendation & personalization using mean average precision at K.
Outline
- Introduction
- Ranking recommendations
- Coding the algorithm
- MAP@K evaluation
- Magical solution
Introduction
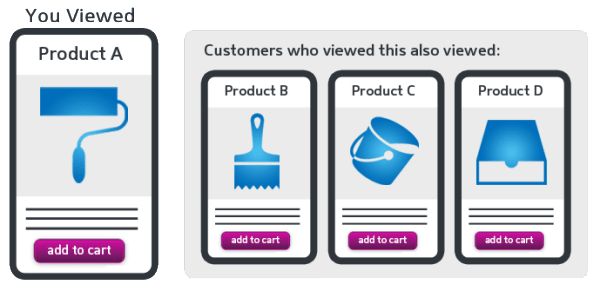
When building a model for ranking items, its common to use them for recommending. Ranking is flexible in terms of a number or a category and can be used for content recommendation or product recommendation. For an e-commerce shop, you need to select what will be the best for each user browsing it at a given time as spending habits and buying habits shift fast.
 E-commerce product recommendation based on views (Source: GrowForce)
In this lesson, well be using collaborative filtering, a machine learning method to group users together and make suggestions based on what the other similar users have clicked. This algorithm is best used to tailor results to a specific individual by matching users with similar audiences. This allows for an output that is crafted especially for the group or cohort.
 Collaborative filtering (Source: B2C)
Well be looking at an example similar to how video streaming services, such as Netflix, Disney+, or Crunchyroll can implement it using machine learning. Additionally, well also cover how to measure its performance which can be applied to other kinds of advanced models such as those used in computer vision or image recognition.
Ranking Recommendations
For this lesson, well be using the movie_ratings dataset to curate a list of movies for each user based on movies theyve watched in the past and their ratings for each. Our dataset will contain a list of movie titles from the American Film Industry (AFI), based on the top 100 American movies of all time. This movie_ratings dataset will contain the user_id, movies watched, and their rating.
Training the Model
From our dataset, well be trying to select 3 columns to determine the goals of our ranking model. Using the ratings dataset, well want to increase the likelihood of a user purchasing more products. In other words, well be ranking products for a user to increase purchases (aka rating).
Now that we have an idea of what kind of model we can evaluate, lets dive into the calculations for mean average precision at k (mAP@K). Well break it down into K, P@K, AP@K, and mAP@K . While this may be called mean average precision at K, don't let its name fool you. Its not calculated by simply taking the average of all precision values.
What exactly is K?
K represents the number of values youd like the top results to be. For instance, a K of 1 will only return the very best suggestion, while a K of 10, will return the top ten suggestions. This is very useful if you have many products, when you recommend them, you dont want to send all of them back, just the ones that are more likely to be clicked. When training a ranking model, this is the number of objects we want to rank in; this would be the limit of products we can show on the recommendation.
Precision at K & Average Precision at K
So if K is the number of objects to rank, precision is the individual value of each object to rank. So for precision at K, we calculate the precision of only the top scoring values up to K. To recap from our precision lesson, its calculated by getting the predicted value of the total positives. In other words, the matches that were positive.
Then to get the average precision, you may be thinking that we would take the sum of all individual values and divide by k. But thats not it, instead we need to consider that its at k as well. This is to account for edge cases where you may want the top 10, k = 10, but you only have a list of 6 movies to begin with.
Mean Average Precision at K
If your model only has one customer in it, then youre done here. Otherwise, youll want to check the mean average precision to get an idea of just how diverse each user is. This is the pinnacle and the calculation will need to represent the entire model not just a specific individual. As a result, well be taking all the AP@K values for each unique chosen group, aka user to movie. Then well average that by taking the sum and dividing by the total number of users.
Coding the algorithm
For this lesson, were going to focus on the evaluation portion. Weve already pre-cleaned this dataset and trained the model using linear regression. As a result, it came up with a list of outputs as predictions, so now lets take a dive into the performance.
Python
Starting with Python were going to code the functions from scratch using the values determined from the linear regression model. First were going to write a function to calculate the Average Precision at K. It will take in three values, the value from the test set, and value from the model prediction, and finally the value for K. This code can be found in the Github for the ml_metrics Python Library.
1 def apk(actual, predicted, k=10)2 if len(predicted)>k:3 predicted = predicted[:k]4 score = 0.05 num_hits = 0.06 for i,p in enumerate(predicted):7 if p in actual and p not in predicted[:i]:8 num_hits += 1.09 score += num_hits / (i+1.0)10 if not actual:11 return 0.012 return score / min(len(actual), k)This first function only calculates the Average Precision at K. To break this down, we take a subset of the predictions, only up to k. Note that this subset is only applied to the models predictions, not the actual (truth) set. Next, we iterate over the values to calculate the total precision and divide by the lesser value between the test set and k.
By using this apk function, we can then calculate the mean using the same library.
1 np.mean([apk(a,p,k) for a,p in zip(actual, predicted)])Similarly, this will unpack the values and take the mean using the sum of the return divided by the number of times apk was called.
Map@K evaluation
Now that you know how to calculate the values, lets quickly discuss what would be good or bad values. Generally, a machine learning model is good if its better than the baseline values. When you increase K, if your models MAP@K value is rising thats a good sign that the recommendation works. On the other hand, if your models values are less than the baseline, something is wrong with the model and you may need more data. Some additional features you should consider for retraining your recommendation model could be views, watchtime, or genre.
Choosing MAP@K
When using MAP@K for a recommendation model, I consider MAP@K the one metric.
 MAP@K is one metric to rule them all (Source: LotR)
While MAP@K may be an advanced metric, for the specialization of recommendations it trumps other model evaluation metrics and can be used as the one metric that matters.
Precision over recall
When recommending products precision, focusing on the positives (i.e theyll click), is better than its counterpart recall, looking at the negatives (i.e they wont click). Especially, when ranking on a positive or increasing output. Likewise, because recall doesnt matter as much F1-Score is no longer the best metric.
K more than a score
Similarly, K is a variable length that can be split apart. When performing an evaluation and making predictions its good to take into account trends in the present and the future. This is why it can be better than the ROC AUC score which creates a broadened generalization ignoring short bursts or trendy data.
Magical solution
MAP@K Is an advanced metric that has yet to be explored more within machine learning. Mage is specialized in creating ranking models that support collaborative filtering in order to make recommendation models accessible for small businesses.
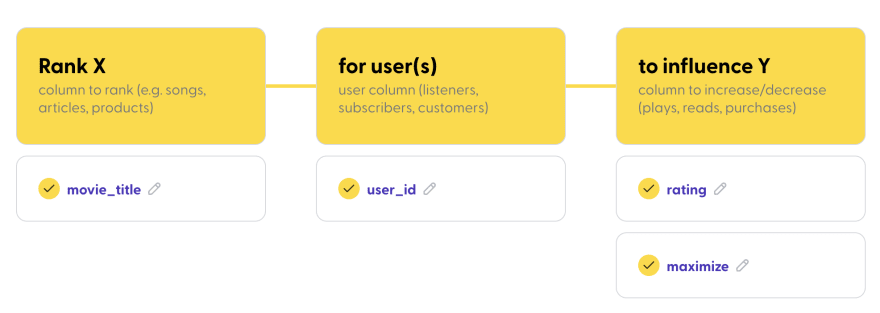
Mage is simple and breaks down the ranking model flow into 3 basic questions.
- Who is it for?
- What do you want to rank?
- What should increase as a result?
Then, you may follow our suggestions to think like a data scientist and train a model.
Performance
Once thats complete and you have a model youre greeted by the overview & statistics screen. For recommendation models, Mage is smart enough to use Mean average precision and provides it at 1,5, and 10.
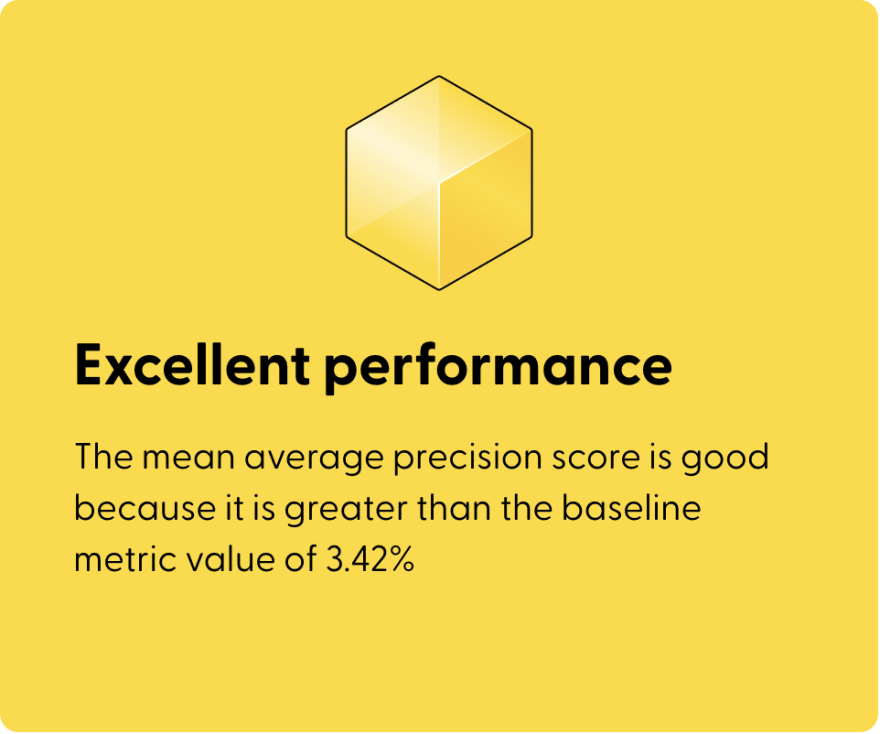
Here, we see that the model did beat the baseline, and its overall performance is excellent, because it beat the baseline.

We also notice that for better performance, its best to have higher Ks. Now a value of 17% Average performance, means that a user is 17% likely to click on any of the recommended, as it expands to 10 choices the likelihood rises which shows the model is working as intended.
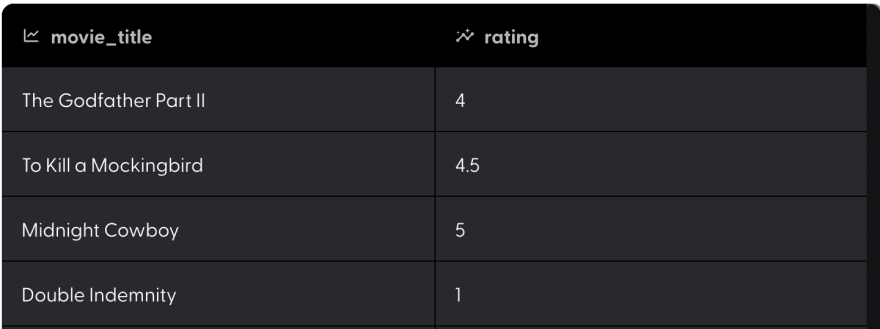
Recommendations
Under the samples tag, you can see what factors mattered. For instance, in the case of user 474, because they loved The Godfather Part II and disliked Double Indemnity we use this information to suggest other movies similar users liked.
Because you reviewed the movies like this, we suggest that you try watching

Isnt that great? Now you can use AI to do things that enterprises require a large team of dedicated professionals for. We hope you enjoyed this lesson on MAP@K and recommendation models. For more knowledge on machine learning, visit Mage Academy. If youre interested in this low-code AI tool, please sign up and try Mage.
Original Link: https://dev.to/mage_ai/model-evaluation-mapk-13i6
Dev To
More About this Source Visit Dev To