
An Interest In:
Web News this Week
- April 27, 2024
- April 26, 2024
- April 25, 2024
- April 24, 2024
- April 23, 2024
- April 22, 2024
- April 21, 2024
Some of Our Sources
- Slashdot
- Joshua Blankenship
- Pearsonified
- Smashing Apps
- You The Designer
- Crazy Leaf Design
- Reencoded
- 24 Ways
- Web Resource Source
- Willems Lab
Help Webnuz
Referal links:
Tutorial: Adding Analytics to the CryptoPunks V1 Site
For an NFT project, it can be hard to add items like recent sales and charts to a website. There are existing NFT APIs, however, most require API keys you wouldn't want to expose to the user. Let's use the fully open (and free) Sort API to add analytics to the CryptoPunks V1 website using only client-side Javascript.
We'll include the full example (which you can inspect to see the code) below.

Adding a real-time sales feed
The first thing we'll do is form our API call
POST https://api.sort.xyz/v0/transaction{ "nft_event": "sale", "nft_address": "0x282bdd42f4eb70e7a9d9f40c8fea0825b7f68c5d", "limit" : 10, "timestamp" : "gte:2022-04-01", "fields" : { "logs" : 0, "function" : 0 }}- nft_event - only look for sales
- nft_address - use the CryptoPunks V1 contract address
- limit - get the latest 10 results
- timestamp - only search after 2022-04-01 (greater than or equal to, gte)
- fields - omit 2 very long fields from the response to increase performance
Write our Javascript
var sortxyz_result = await axios.post('https://api.sort.xyz/v0/transaction', { "nft_event": "sale", "nft_address": "0x282bdd42f4eb70e7a9d9f40c8fea0825b7f68c5d", "limit" : 10, "timestamp" : "gte:2022-04-01", "fields" : { "logs" : 0, "function" : 0 } });let sortxyz_data = sortxyz_result.data.result;for (var i=0; i<sortxyz_data.length; i++) { // Fill in our HTML}Notice the field values from the API response we'll use in our HTML:
new_sale.innerHTML = "<div class=\"row\"> " + "<div class=\"col\"> " + "<img width=\"75\" class=\"lazyload\" src=\""+sortxyz_data[i].nft.image_url+"\" />" + "</div>" + "<div class=\"col\">" + "<div>" + sortxyz_data[i].nft.value_eth + "</div>" + "<div>#" + sortxyz_data[i].nft.token_index + "</div>" + "</div>" + "</div>";- nft.image_url - The URL to the image of the punk sold
- nft.value_eth - Value of sale in ETH (no conversions needed)
- nft.token_index - The ID of the punk sold
Display our feed

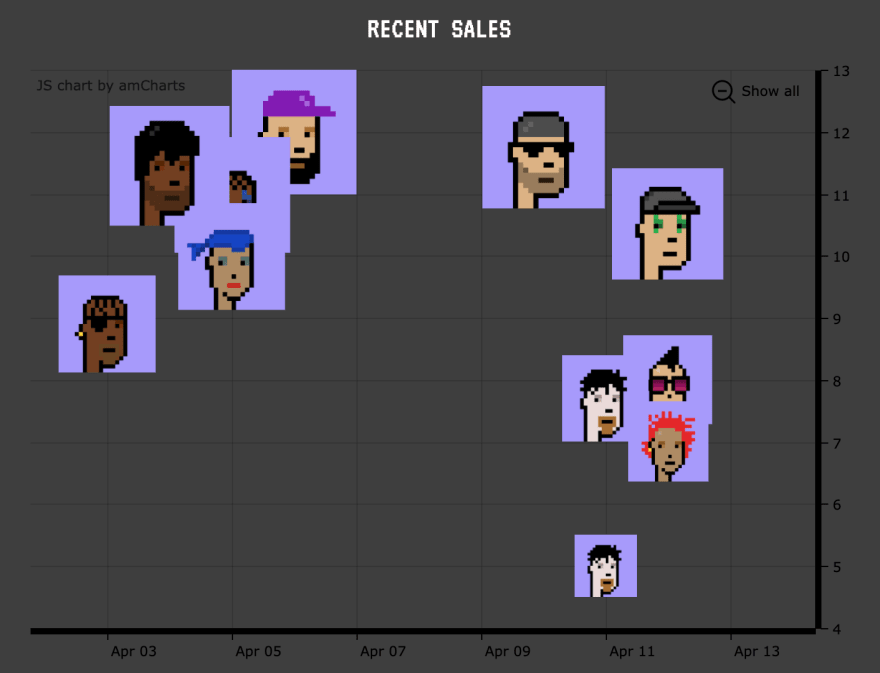
Adding a scatter plot chart for recent sales
We'll use the same API call from the previous sales feed, however, we'll use the timestamp from the transaction in our bubble/scatter plot chart.
POST https://api.sort.xyz/v0/transaction{ "nft_event": "sale", "nft_address": "0x282bdd42f4eb70e7a9d9f40c8fea0825b7f68c5d", "limit" : 10, "timestamp" : "gte:2022-04-01", "fields" : { "logs" : 0, "function" : 0 }}Use the timestamp in our chart
let sortxyz_data = sortxyz_result.data.result;for (var i=0; i<sortxyz_data.length; i++) { let chart_item = { "y": sortxyz_data[i].nft.value_eth, "date" : sortxyz_data[i].timestamp, "value": sortxyz_data[i].nft.value_eth, "image": sortxyz_data[i].nft.image_url, "punk" : sortxyz_data[i].nft.token_index } ...}- For the date of the transaction, we'll use 'sortxyz_data[i].timestamp'
Add our chart
Adding a chart for average sale price
We'll need to aggregate data to get the average CryptoPunks V1 sales price per day.
{ "nft_event": "sale", "nft_address": "0x282bdd42f4eb70e7a9d9f40c8fea0825b7f68c5d", "aggregate" : { "op" : "avg", "by" : "day", "field" : "nft.value_eth" }, "limit" : 10, "timestamp" : "gte:2022-04-01"}- nft_event, nft_address - same as before, no changes here
- aggregate - get the avg value of the field 'nft.value_eth', bucketed by day
- limit - last 10 results
- timestamp - start at 2022-04-01
Parsing the aggregation API result
let sortxyz_data = sortxyz_result.data.result;let position = 0;for (var i=0; i<sortxyz_data.length; i++) { let chart_item = { "y": sortxyz_data[i].total, "x": position, "date" : sortxyz_data[i].timestamp}The result from this API call has a different format from previous API calls, since we're aggregating data instead of returning enriched transactions.
Add our chart

Bonus: Add contract events
We can add additional information, such as contract events (not shown within the mockups).
POST https://api.sort.xyz/v0/transaction{ "contract_address": "0x282bdd42f4eb70e7a9d9f40c8fea0825b7f68c5d", "limit" : 10}Putting it all together
Access the completed example here (view source code to see complete Javascript examples).
View the Sort API docs to learn more, and create even more complex aggregations and queries.
Original Link: https://dev.to/sort_xyz/tutorial-adding-analytics-to-the-cryptopunks-v1-site-4ad0
Dev To
More About this Source Visit Dev To