
An Interest In:
Web News this Week
- April 26, 2024
- April 25, 2024
- April 24, 2024
- April 23, 2024
- April 22, 2024
- April 21, 2024
- April 20, 2024
Some of Our Sources
- Team Treehouse
- Just Creative
- Inspiredology
- 24 Ways
- Stylized Web
- Wal You
- Spyre Studios
- Codrops
- Android Headlines
- Willems Lab
Help Webnuz
Referal links:
Create a temperature map with Mapbox and OpenWeatherMap
A temperature maps shows the current temperature in a color scale, from blue (cold) to red (hot). In this tutorial, I will show how to create a web-based temperature map using JavaScript, Mapbox, and OpenWeatherMap.
To follow this tutorial, you just need some knowledge in web development (HTML, CSS, Javascript).
We will:
- Create a map using Mapbox.
- Fetch temperature data using OpenWeatherMap.
- Use a custom Mapbox layer to display a color scale of the temperature.
The result is displayed here and the source code is accessible here.
1. Setting up the project
The first step is to set up the web page. Since it's only a web application running on a client side, we just need a HTML and a JavaScript file.
Create an empty map.js file. This file will contain the map creation and the retrieval of weather data. Then, create an index.html file with the following code:
<!DOCTYPE html><html> <head> <meta charset="utf-8"> <title>Temperature map</title> <style> body { margin: 0; padding: 0; } #map { position: absolute; top: 0; bottom: 0; width: 100%; } </style> </head> <body> <div id="map"></div> <script src="map.js"></script> </body></html>We just add a map div that takes the entire available space. It will contain the map.
2. Creating the map
To display a map in our web page, we need a map provider. Many exist, but we will use Mapbox in this tutorial because it is highly customizable and free up to 50,000 map load per month (which means that 50,000 monthly requests on your web page can be made).
First, create a Mapbox account. Then, go to your profile page and copy your default public token. This is used to identify yourself when requesting map data.
We can now add the map on our web page. Mapbox provides SDK for different platforms (Android, iOS, Unity) so since we want to create a web application we are going to use Mapbox GL JS. This SDK can be installed via a npm module, or by simply including the JavaScript and CSS files in the <head> of our HTML file:
<!DOCTYPE html><html> <head> <meta charset="utf-8"> <title>Temperature map</title> <link href="https://api.mapbox.com/mapbox-gl-js/v2.3.0/mapbox-gl.css" rel="stylesheet"> <script src="https://api.mapbox.com/mapbox-gl-js/v2.3.0/mapbox-gl.js"></script> <style> body { margin: 0; padding: 0; } #map { position: absolute; top: 0; bottom: 0; width: 100%; } </style> </head> <body> <div id="map"></div> <script src="map.js"></script> </body></html>In the map.js file, add the following lines:
mapboxgl.accessToken = 'your_mapbox_access_token'; // past your default public tokenconst map = (window.map = new mapboxgl.Map({ container: 'map', // 'map' is the id of the HTML div style: 'mapbox://styles/mapbox/light-v10'}));This is the simplest way of creating a map. The style parameter will determine how your map will look like. Mapbox provides default styles, but you can also create your own by using Mapbox Studio.
Other parameters, such as the inital zoom and geographical centerpoint of the map, can be specified. You will find all available parameters on the API documentation.
3. Gathering weather data
The next step is to collect data on the current weather by the mean of a weather API. Several free providers exist. For this tutorial, I chose to use OpenWeatherMap.
OpenWeatherMap is an online service that provides among other things global weather data. To use this API, you will have to create an account and get your API key. The free plan includes 60 calls to the API per minute.
The documentation for getting the current weather data is available here. In this tutorial, we will fetch the current temperature in degree Celsius by geographic coordinates. Therefore, the URLs will be like: https://api.openweathermap.org/data/2.5/weather?units=metric&lat=latitude&lon=longitude&appid=apiKey.
Since the goal of this tutorial is to create a temperature map, we want to fetch the temperature at different locations that cover the entire globe. In geography, latitude goes from -90 to 90, and longitude from -180 to 180. However, Mapbox uses the Web Mercator projection, which projects the poles at infinity, so we cannot see the poles. Therefore, let's define some points going from -80 to 80 for the latitude.
const startingLatitude = -80;const startingLongitude = -180;const endingLatitude = 80;const endingLongitude = 180;const n = 10; // n is the number of pointsconst points = [];for (let i=0; i < n; i++) { for (let j=0; j < n; j++) { points.push({ lat: startingLatitude + i * (endingLatitude - startingLongitude)/n, lng: startingLongitude + j * (endingLatitude - startingLongitude)/n, val: 0 // val will store the temperature }) }}Each element of the points array is an object with a latitude, a longitude, and a value corresponding to the temperature for that location. We set the default temperature to 0, so now let's get the real value:
const startingLatitude = -80;const startingLongitude = -180;const endingLatitude = 80;const endingLongitude = 180;const n = 10;(async() => { const points = []; for (let i=0; i < n; i++) { for (let j=0; j < n; j++) { points.push({ lat: startingLatitude + i * (endingLatitude - startingLatitude)/n, lng: startingLongitude + j * (endingLongitude - startingLongitude)/n, val: 0 }) } } // Create the URLs const baseUrl = "https://api.openweathermap.org/data/2.5/weather?units=metric&lat="; const apiKey = 'your_weather_api_key'; const urls = points.map(point => baseUrl + point.lat + "&lon=" + point.lng + "&appid=" + apiKey); // Fetch the weather data const weathers = await Promise.all(urls.map(async url => { const response = await fetch(url); return response.text(); })); // Set the temperature points.forEach((point, index) => { point.val = JSON.parse(weathers[index]).main.temp; })})();Three steps are done here:
First, we need to define the URLs which will be used to communicate with the weather API. We use the model URL presented above and we set the latitude and longitude of the previously defined points. Remember to set your API key available here.
Then, we perform the requests with the
fetch(url)function. Since it's an asynchronous operation and we need to wait for it to finish, we use the keywordawait. The functionPromise.all()is used to perform all the requests in parallel, and, with the keywordawait, we wait for all requests to finish.awaithas to be inside anasyncfunction, so we surround the whole code with(async() => {})();. If you don't understand this part, here is the equivalent code if we had only one URL to fetch:
(async() => { const response = await fetch(url); const weather = await response.text(); })();We fetch a response from an URL, and then we store the content of the response in the weather variable. These two operations are asynchronous, so we need to use await.
- We have now a
weathersarray containing some weather data for all ourpoints, so we just need to extract the temperature by using the documentation.
We have now an array of locations with associated temperatures.
4. Creating the color scale
We can now create the color scale by providing the array of points to the map.
Each element of a Mapbox map is part of a layer: there is a layer for roads, tunnels, parks, countries, for every type of label... So the color scale we want to add to the map will be implemented by a layer defined by us.
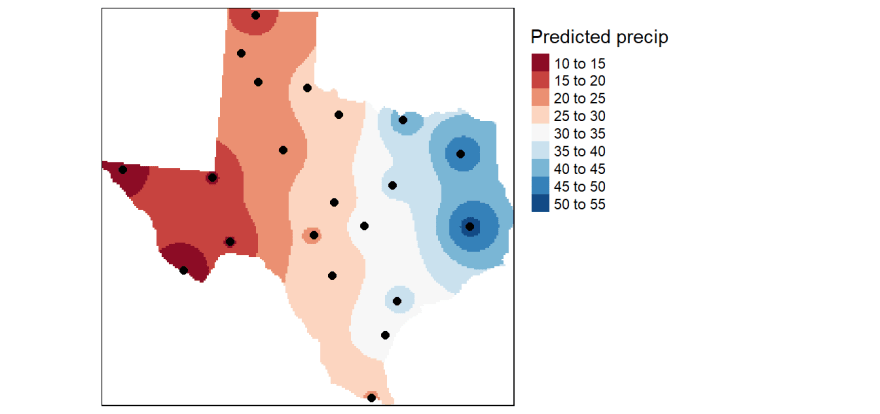
Mapbox natively provides a heatmap layer. This is close to what we want, but not exactly. Take a look on these pictures:
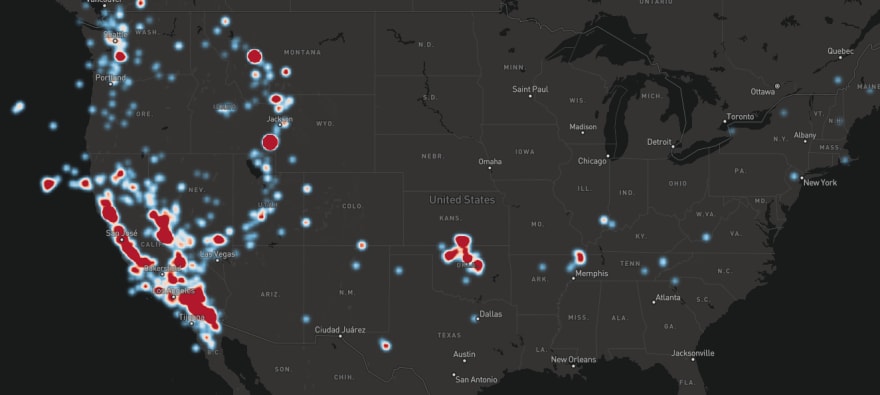
The Mapbox heatmap layer can represent the density of points in an area (like on the first picture). The color doesn't depend on the value of a point but on the density of points (actually the value can change the color but it is mainly the density that will affect the color).
For our temperature map, we want a heatmap that can define a color to any location by making an average of the values of the surroundings points (like on the second picture).
I created a way of representing this type of heatmap. The project is available on GitHub here. Download the interpolateHeatmapLayer.js file, place it in your working folder and include it before the map.js script:
<body> <div id="map"></div> <script src="interpolateHeatmapLayer.js"></script> <script src="map.js"></script></body>You can now call the interpolateHeatmapLayerinterpolateHeatmapLayer.create() function to create the layer, and add it to the map. Here the whole script:
mapboxgl.accessToken = 'your_mapbox_access_token';const startingLatitude = -80;const startingLongitude = -180;const endingLatitude = 80;const endingLongitude = 180;const n = 10;(async() => { const points = []; for (let i=0; i < n; i++) { for (let j=0; j < n; j++) { points.push({ lat: startingLatitude + i * (endingLatitude - startingLatitude)/n, lng: startingLongitude + j * (endingLongitude - startingLongitude)/n, val: 0 }) } } const baseUrl = "https://api.openweathermap.org/data/2.5/weather?units=metric&lat="; const apiKey = 'your_weather_api_key'; const urls = points.map(point => baseUrl + point.lat + "&lon=" + point.lng + "&appid=" + apiKey); const weathers = await Promise.all(urls.map(async url => { const response = await fetch(url); return response.text(); })); points.forEach((point, index) => { point.val = JSON.parse(weathers[index]).main.temp; }) const map = (window.map = new mapboxgl.Map({ container: 'map', style: 'mapbox://styles/mapbox/light-v10' })); // When the map is loaded, create and the color scale layer map.on('load', () => { const layer = interpolateHeatmapLayer.create({ points: points, // use our array of points layerID: 'temperature' // define an ID for the layer }); map.addLayer(layer); });})();The color scale layer can only be added when the map is loaded, so we add an handler to the load event. The layer expects at least:
- An array of points, each point being an object containing a latitude
lat, a longitudelon, and a valueval. - An ID, which is the unique Mapbox layer name.
Other parameters are:
opacity: a number between 0 and 1 describing the transparency of the color.minValue: define the value corresponding to the blue color. When it's not defined, this is the lowest temperature ofpointswhich is represented by the blue color. There is alsomaxValuefor the red color.framebufferFactor: number between 0 and 1. In short, if the framebuffer factor is around 0, the computation will be faster but less accurate and the opposite if it's around 1. The default value is 0.3. Take a look at thereadmefile of the GitHub project if you want to know what exactly this parameter is.p: a factor affecting the computation of the color, from 0 to around 15. A high value makes the color uniform around each point. Once again, take a look at the GitHub project if you want to know more.roi: list of coordinates (likepoints) defining the area of interest, aka the area where the temperature map will be present. By default, the entire world is colored.valueToColor: function defining the range of color of the temperature map. By default, a low temperature is colored blue, a medium green and a high red.
Right now, the temperature is represented above everything else on the map. Instead, it would be better to have the different labels above the temperature map, so we are going to use the second parameter of the map.addLayer() function. The Mapbox documentation states that this parameter is the "ID of an existing layer to insert the new layer before, resulting in the new layer appearing visually beneath the existing layer". The layers are defined in the style parameter of the map, so we need to find the lowest label layer of the light-v10 style (the one used here).
To do this, go to Mapbox Studio, create a new style, and choose the Monochrome template with the light variation. Then, go to the Layers tab on the left panel. All labels appear, the first ones being the upper layers (appearing above the others on the map). The last layer with label written on it is road-label. Therefore, perform the following modifications to your script:
// ...(async() => { // ... map.on('load', () => { const layer = interpolateHeatmapLayer.create({ points: points, layerID: 'temperature' }); map.addLayer(layer, 'road-label'); });})();The temperature map is now below the labels.
5. Conclusion
You know now how to create a temperature map with Mapbox and OpenWeatherMap. I wrote this article to provide an example of using the interpolate heatmap layer, but it can also be used for visualizing generic geographical data.
Original Link: https://dev.to/rylern/create-a-temperature-map-with-mapbox-and-openweathermap-2ojb
Dev To
More About this Source Visit Dev To