
An Interest In:
Web News this Week
- April 15, 2024
- April 14, 2024
- April 13, 2024
- April 12, 2024
- April 11, 2024
- April 10, 2024
- April 9, 2024
Some of Our Sources
- Simplebits
- TutsPlus - Code
- Abduzeedo
- You The Designer
- Creative Curio
- Naldz Graphics
- Reencoded
- Line 25
- Design Modo
- Willems Lab
Help Webnuz
Referal links:
Machine learning in Scratch??
Wait, really?
Yes, absolutely! Scratch has all the necessary tools for a working linear regression with gradient descent. With a few nifty tricks, we can even visualize how the algorithm works!
What is Scratch, though?
Scratch is a project of the Scratch Foundation, in collaboration with the Lifelong Kindergarten Group at the MIT Media Lab. It is available for free at https://scratch.mit.edu. Scratch is a tool to teach programming by offering a GUI where instructions are combined via drag&drop. Sprites and backgrounds allow for a user interface with animations and user input. One create all kinds of programs, like simple interactive movies, entire games, or, well, machine learning algorithms.
Machine learning in Scratch? Why would you even do this?
Because it's possible. I wanted to explore the boundaries of Scratch and figure out new ways to solve certain problems. It made me understand the algorithm better and think outside the box. Besides: I've got a little history in implementing those things in languages or tools you wouldn't expect:

This post also explains how linear regression works and how to implement it.
Ok, let's implement linear regression in Scratch then!
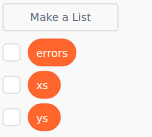
Awesome! First, I need some data. For linear regression, that's a bunch of XY-coordinates. Since Scratch doesn't have nested lists, I keep them in separate lists. A third list keeps track of the error values, so we can inspect or display it later.
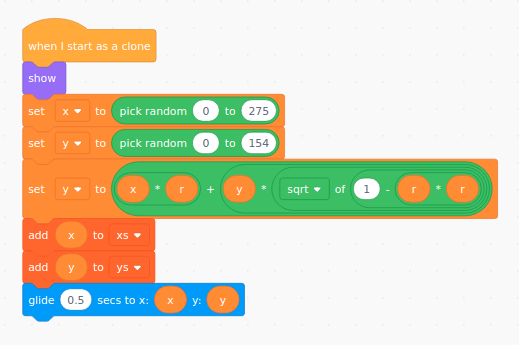
I'm generating the data now, because why not. I could simply generate random data, but some kind of correlation would be nice. UVM has a good formula for that. First, xxx and yyy are set randomly. Then, a new yyy is calculated with this formula, with rrr as the "rate of correlation":
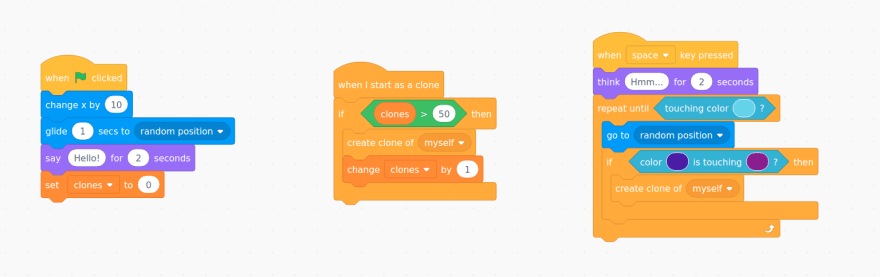
I create a new sprite with a single red dot in the center and tell it to calculate it's own coordinates as soon as it's created. I can then clone this point sprite to create new as many data points as I want:
The nice thing about this: The data is already visualized. This comes more or less out of the box.
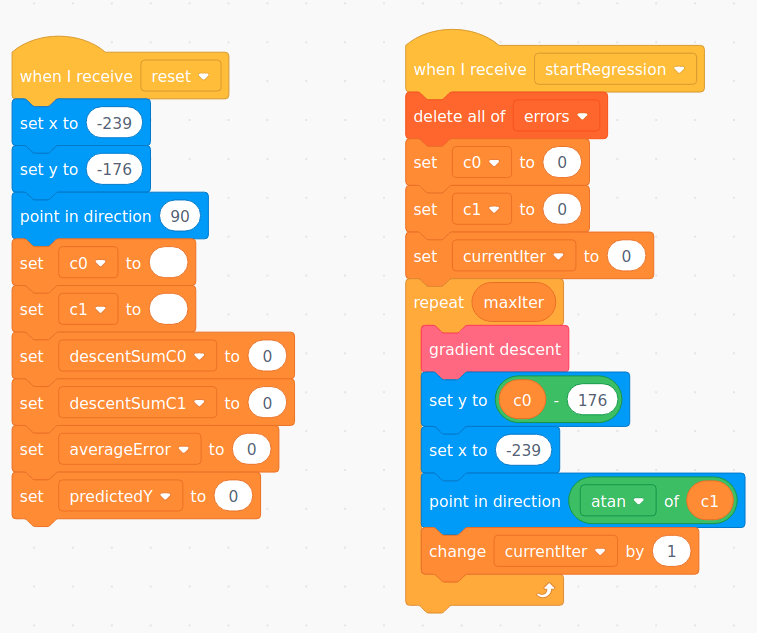
I now introduce the variable m and set it to 100, to know how many data points I need. Next, I create a "main" sprite that's empty, basically the main entry point of my program. Think of it like Java's public static void main(String[] args). There I reset all the variables, set the parameters I need for the linear regression/gradient descent and clone the data point m times:
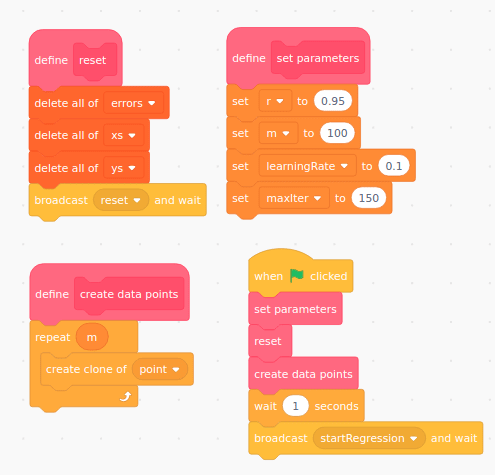
And that's the result so far:

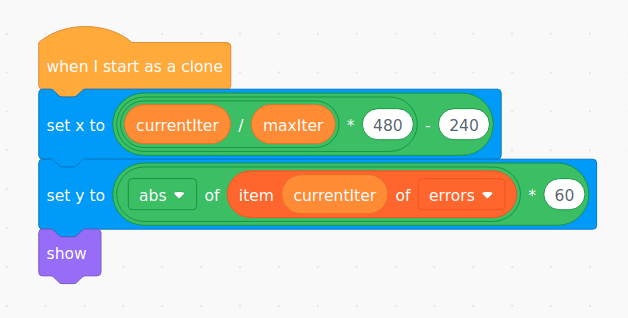
Next, I create a sprite called "error point" to plot the error rate. The "error point" is similar to the data point sprite. Also, since the "errors" list is already public, I introduce two more variables: maxIter for the total number of iterations of gradient descent and currentIter to know which iteration I'm currently at. For each iteration, I create a clone of the "error point" and tell it to adjust itself, to get a nice plot of the error rate:
Next, I introduce a sprite called "line". This is where the main logic will happen. The line can basically adjust itself, rotate and move, whatever its internals tell it to do.
Linear regression basically tells me the coefficients c0c_0c0 and c1c_1c1 of a linear function. I can use those to calculate a single point (i.e. (x,c0+c1x)(x, c_0 + c_1 * x)(x,c0+c1x)). To calculate the angle \alpha of the hypotenuse, I can use this formula:
Therefore:
When I assume xxx as 1 and neglect c0c_0c0 (this is only moving the line, not rotating it), I can calculate the angle of the line as this:
This is then part of the iteration of gradient descent in the "line" sprite:
So far so good. I've got data points, I've got an error plot, I've got a line that I can move around. Now for the fun part: The linear regression with gradient descent itself.
I've worked with two lists for x's and y's since Scratch doesn't allow for nested lists. Minor inconvenience, but nothing that'll stop me.
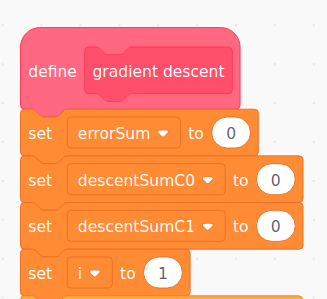
So, first, I'll give the variables used in the loop some default values:
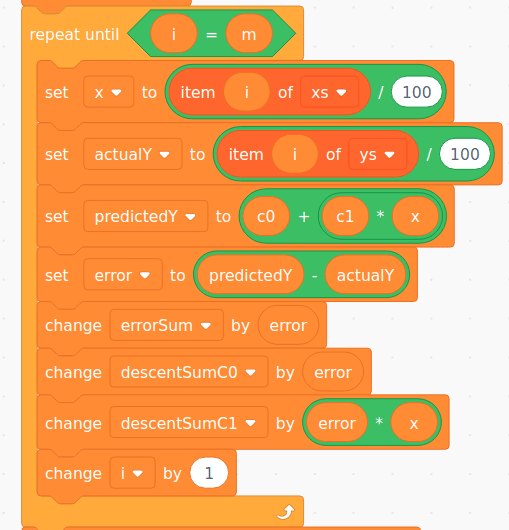
Next up: Looping through the data points to calculate the different between predicted Y and actual Y:
Next, I use the sums descentSumC0 and descentSumC1 to calculate new versions of c0 and c1 and set them simultaneously:

After this block ran through, the line is adjusted and a new calculation is done. Until the maximum number of iterations is reached.
And this works?
Yup:
For the full code and to try it yourself, here's the Scratch project: scratch.mit.edu/projects/520553339
I hope you enjoyed reading this article as much as I enjoyed writing it! If so, leave a or a ! I write tech articles in my free time and like to drink coffee every once in a while.
If you want to support my efforts, buy me a coffee or follow me on Twitter ! You can also support me directly via Paypal!

Original Link: https://dev.to/thormeier/let-s-do-machine-learning-in-scratch-h1c
Dev To
More About this Source Visit Dev To