
An Interest In:
Web News this Week
- April 23, 2024
- April 22, 2024
- April 21, 2024
- April 20, 2024
- April 19, 2024
- April 18, 2024
- April 17, 2024
Some of Our Sources
- Technology Review
- Web Designer Wall
- TutsPlus - Design
- You The Designer
- Fudge Graphics
- CSS Globe
- Specky Boy
- Freelance Switch
- Codrops
- Dev To
Help Webnuz
Referal links:
Monitoring Linux instances with Prometheus andGrafana
If you want to know how is everything going in your servers, you must monitor them, yeah, sometimes read htop or similar commands output can be hard to understand, there are a lot of alternatives, and today I am going to show you how to set up a monitoring suite to always know what is going on your servers, linux instances, and more.
In this tutorial, I will show you how to mount a complete, flexible, and scalable monitoring system, using two great (and free) tools.
What are we going touse?
Prometheus is a powerful, open-source and easy-to-use monitoring solution, it is going to help us to collect and fetch a lot of information from your Linux instances.
Grafana on the other hand, is the most popular technology to create monitoring dashboards in a fast and easy way, also it has a lot of plugins and integrations, therefore, if it exists, you can create a Grafana panel for it.
Let's start!
Installing node_exporter
First of all, we will need to install a Prometheus light-weight daemon in all your servers that you want to monitor, this daemon is node_exporter.
Let's install it.
Connect to your server
$ ssh user@target-instanceDownload the node_exporter files
$ wget https://github.com/prometheus/node_exporter/releases/download/v1.0.1/node_exporter-1.0.1.linux-amd64.tar.gzUncompress and rename the folder$ tar xvf node_exporter-1.0.1.linux-amd64.tar.gz$ mv node_exporter-1.0.1.linux-amd64 ne_filesCreate a new user
$ sudo useradd --no-create-home -s /bin/false node_exporterChange the node_exporter binary ownership to your new user$ sudo chown node_exporter:node_exporter ./ne_files/node_exporterLet's add node_exporter to your local binaries
$ sudo mv ./ne_files/node_exporter /usr/local/bin/Now we are adding node_exporter as a new service
Create a service file for node_exporter with
$ sudo vim /etc/systemd/system/node_exporter.serviceThen, add this to the new file, do not forget to save your changes.
[Unit]Description=node_exporterAfter=network-online.target[Service]User=node_exporterGroup=node_exporterType=simpleExecStart=/usr/local/bin/node_exporter[Install]WantedBy=multi-user.targetReload the services daemon to see your new service
$ sudo systemctl daemon-reloadStart it!
$ sudo systemctl start node_exporterOk, but how do I know it is working?
You can use:
$ sudo systemctl status node_exporterOr go to your favorite browser and navigate tohttp://<target-instance>:9100/metrics
If everything is working, you should see something similar to
# HELP go_gc_duration_seconds A summary of the pause duration of garbage collection cycles.# TYPE go_gc_duration_seconds summarygo_gc_duration_seconds{quantile="0"} 0.000108492go_gc_duration_seconds{quantile="0.25"} 0.000108492go_gc_duration_seconds{quantile="0.5"} 0.000108492go_gc_duration_seconds{quantile="0.75"} 0.000108492go_gc_duration_seconds{quantile="1"} 0.000108492go_gc_duration_seconds_sum 0.000108492go_gc_duration_seconds_count 1# HELP go_goroutines Number of goroutines that currently exist.# TYPE go_goroutines gaugego_goroutines 8# HELP go_info Information about the Go environment.# TYPE go_info gaugego_info{version="go1.14.4"} 1# HELP go_memstats_alloc_bytes Number of bytes allocated and still in use.# TYPE go_memstats_alloc_bytes gaugego_memstats_alloc_bytes 1.846384e+06# HELP go_memstats_alloc_bytes_total Total number of bytes allocated, even if freed.# TYPE go_memstats_alloc_bytes_total countergo_memstats_alloc_bytes_total 3.689864e+06# HELP go_memstats_buck_hash_sys_bytes Number of bytes used by the profiling bucket hash table.# TYPE go_memstats_buck_hash_sys_bytes gaugego_memstats_buck_hash_sys_bytes 1.445623e+06# HELP go_memstats_frees_total Total number of frees.# TYPE go_memstats_frees_total counterRemember, you need to repeat this process within every Linux instance that you want to monitor.
Installing Prometheus
Once all your target instances are running node_exporter, we will install Prometheus to scrape and understand your server's metrics.
You can install it either in your localhost or on another server. In this tutorial, we are installing Prometheus in a new server that will monitor everything. Don't worry if you want to install the monitoring suite in your localhost; both processes are very similar.
Connect to your monitoring server
$ ssh user@<monitoring-server>Download the Prometheus files from here
$ wget https://github.com/prometheus/prometheus/releases/download/v2.23.0/prometheus-2.23.0.linux-amd64.tar.gzNow, let's untar and rename the Prometheus files
$ tar xvf prometheus-2.23.0.linux-amd64.tar.gz$ mv prometheus-2.23.0.linux-amd64 p_filesCreate a new user to use Prometheus
$ sudo useradd --no-create-home -s /bin/false prometheusChange the Prometheus binaries ownership
$ sudo chown prometheus:prometheus p_files/prometheus$ sudo chown prometheus:prometheus p_files/promtoolMove Prometheus binaries to your local binaries
$ sudo mv p_files/prometheus /usr/local/bin$ sudo mv p_files/promtool /usr/local/binCreate folders to store Prometheus configuration
$ sudo mkdir /etc/prometheus$ sudo mkdir /var/lib/prometheusDo not forget to change the directories ownership
$ sudo chown prometheus:prometheus /etc/prometheus$ sudo chown prometheus:prometheus /var/lib/prometheusCopy configurations to your new folders
$ sudo cp -r p_files/consoles /etc/prometheus$ sudo cp -r p_files/console_libraries /etc/prometheusAs you might guess, yes, you have to change the directories ownership
$ sudo chown -R prometheus:prometheus /etc/prometheus/consoles$ sudo chown -R prometheus:prometheus /etc/prometheus/console_librariesCreate a prometheus.yml file within /etc/prometheus folder
$ sudo vim /etc/prometheus/prometheus.ymlAdd this to prometheus.yml
global: scrape_interval: 10sscrape_configs: - job_name: 'prometheus' scrape_interval: 5s static_configs: - targets: ['<target-instance-1>:9090', '<target-instance-2:9100>']This is a basic Prometheus configuration file. You must add every instance with the node_exporter daemon running in the "targets" array.
Once the prometheus.yml file is ready, change its ownership
$ sudo chown prometheus:prometheus /etc/prometheus/prometheus.ymlNow, let's create a Prometheus service file
$ sudo vim /etc/systemd/system/prometheus.serviceAdd the following configuration to prometheus.service
[Unit]Description=PrometheusWants=network-online.targetAfter=network-online.target[Service]User=prometheusGroup=prometheusType=simpleExecStart=/usr/local/bin/prometheus \ --config.file /etc/prometheus/prometheus.yml \ --storage.tsdb.path /var/lib/prometheus/ \ --web.console.templates=/etc/prometheus/consoles \ --web.console.libraries=/etc/prometheus/console_libraries[Install]WantedBy=multi-user.targetReload the service daemon
$ sudo systemctl daemon-reloadIt's time to run your server!
$ sudo systemctl start prometheusCheck your service status
$ sudo systemctl status prometheusNow, let's check the Prometheus Web UI
Open your favorite browser and navigate tohttp://<monitoring-server-ip>:9090/
Now, you should see something like this,
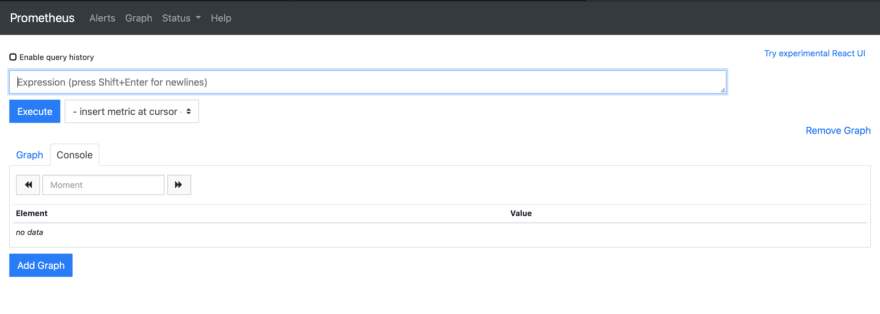
Let's run a simple query to see if Prometheus is retrieving your instances metrics correctly.
Copy the following query into Prometheus Expression input, then click Execute.
sum by (mode, instance) (irate(node_cpu_seconds_total{job="Prometheus",mode="user"}[30s]))*100/4Then, you should see a similar output

As you can see, Prometheus also lists all the instances you added in the targets array before.
Installing Grafana
We have installed node_exporter in your instance to export its metrics.
Then we installed Prometheus on a different server to interpret the instance's metrics. Now, we will install Grafana to create dashboards and charts to make the information easier to read.
The Grafana installation is pretty short. If you want (or need) to install it using the standalone binaries, following the previous steps should give you an idea.
Grafana has a "ready to download and install" deb package; using the following snippet should install Grafana as a new service.
$ sudo apt-get install -y adduser libfontconfig1$ wget https://dl.grafana.com/oss/release/grafana_7.3.4_amd64.deb$ sudo dpkg -i grafana_7.3.4_amd64.debOnce Grafana installation is done, run the service with
$ sudo systemctl start grafana-serverNow open a new tab on your browser and navigate tohttp://<monitoring-server>:3000
You should see a login screen.
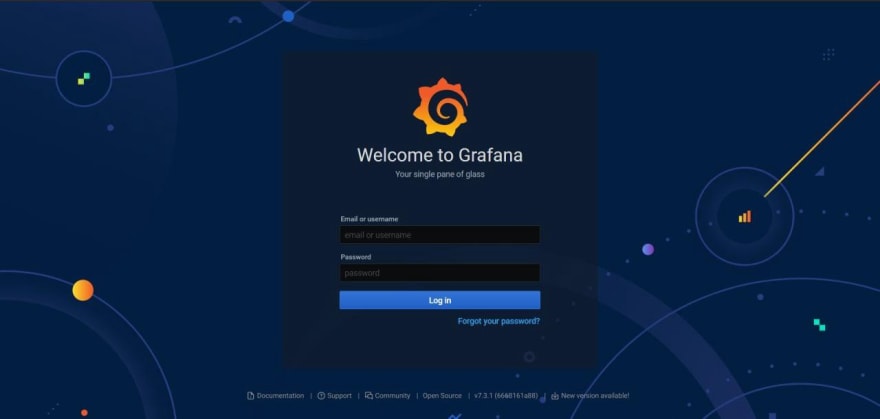
The default username and password are always "admin" after you log in, Grafana will ask you to change your admin password. Remember to use a strong password, please.
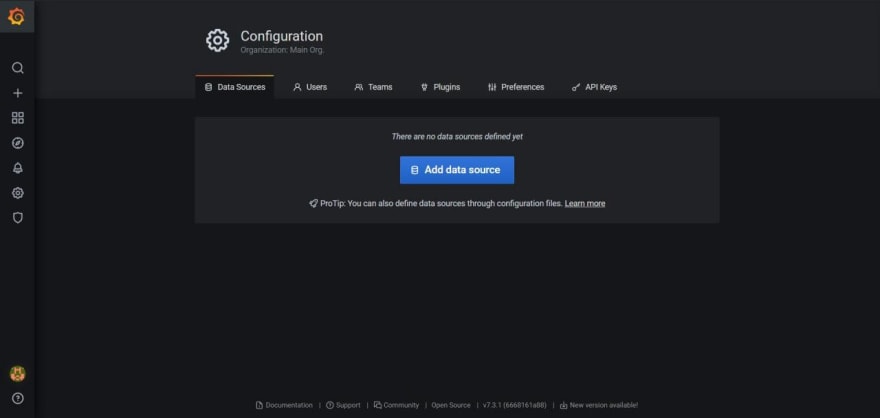
Now, let's go to setup a new Data Source to fetch information from our Prometheus service.
Click the gear icon on the left bar, then click the Data Sources section.

Then click the Add data source button
As you might guess, yes, we will add a new Prometheus data source
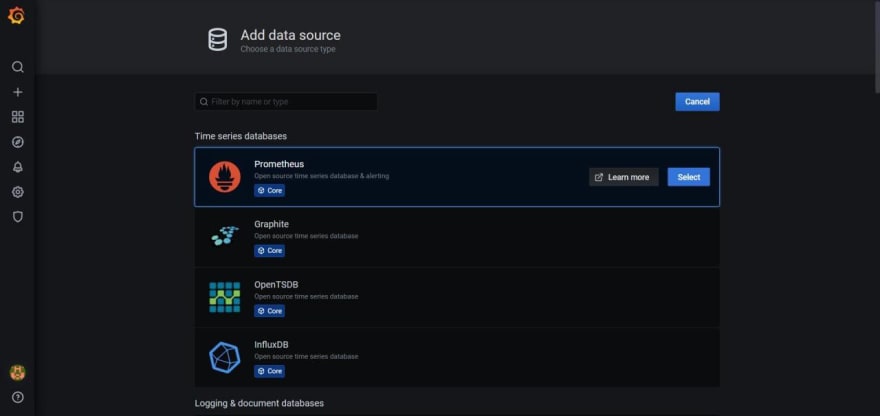
You should see a similar screen
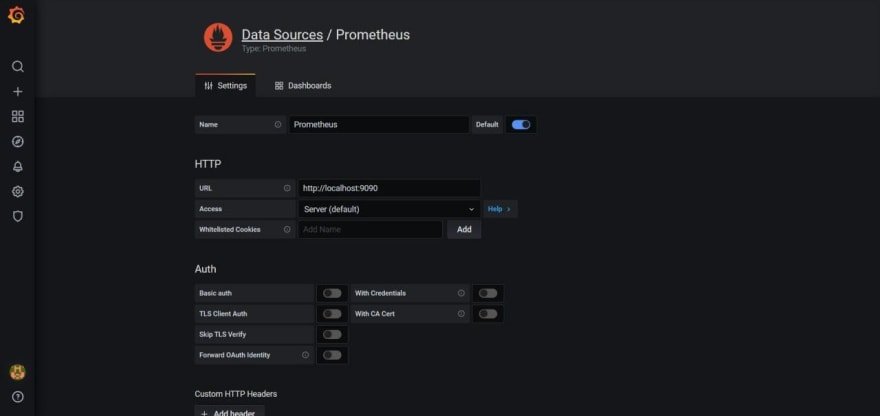
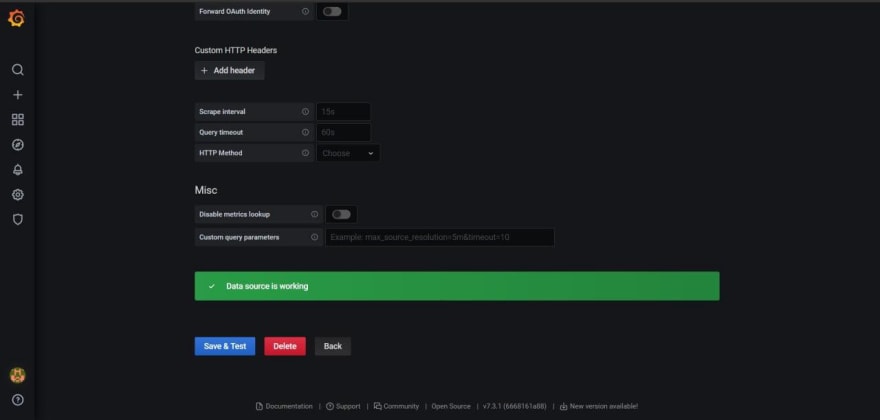
Set the HTTP URL to use your Prometheus service, by default it is set to localhost, which is true in this case, because Grafana and Prometheus are running in the same host.
Then scroll down and click on "Save and test"
Now, navigate to Manage dashboard sections, click the dashboard button on the left bar, then click on "Manage" button.

In this screen, click on Import
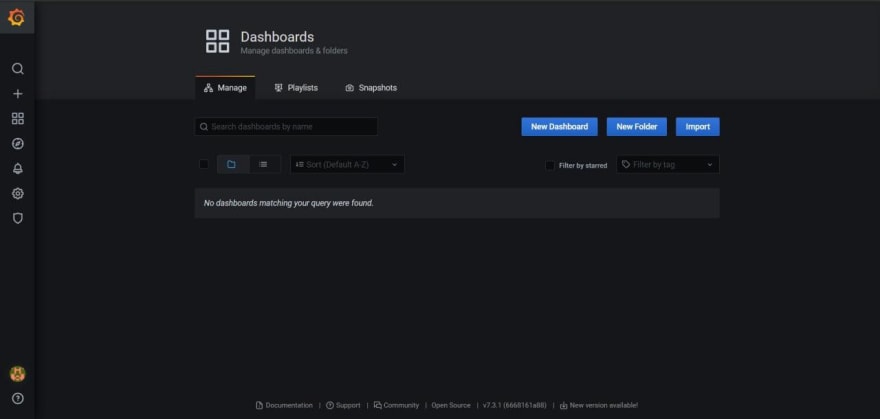
You should get this screen, as you can see, there are some ways to import dashboards, click on Upload JSON file.
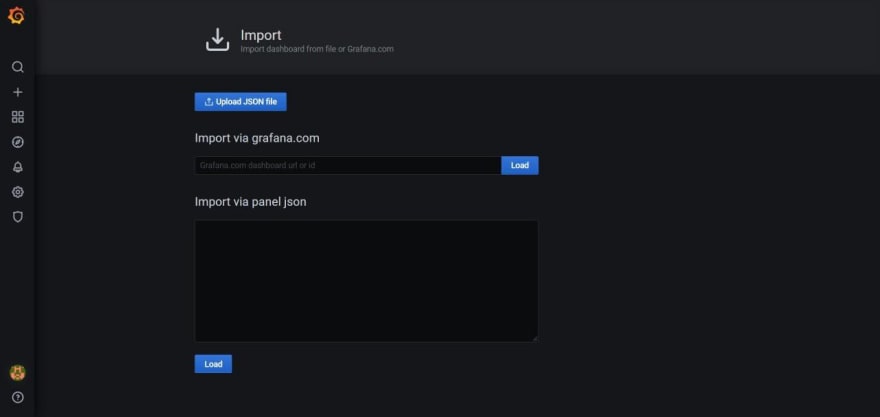
You can find a lot of examples on internet or, if you prefer, you can create your own custom dashboard. For this tutorial we are using this dashboard, developed by Grafana Labs.
Download the JSON file and select it at the file explorer, then this window should be displayed.
Note: You can find a lot of dashboards here.
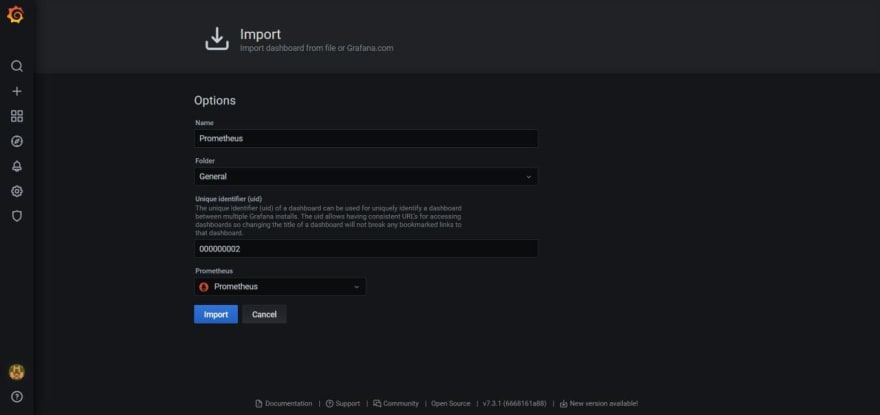
Just keep going with the dashboard settings, remember to choose the right Prometheus dashboard at the "Prometheus" dropdown, then, click on import.

And now, your dashboard is ready!
At the upper left corner, is a "Host" dropdown, there you can select any of your instances added to the Prometheus configuration file.
Yes, those are a lot of charts, Grafana allows you to remove or add as many as you want, so, get fun creating your own monitoring dashboard!
Thanks for reading, this is my first tutorial/blog ever! I will appreciate any feedback or comment.
Original Link: https://dev.to/aldorvv__/monitoring-linux-instances-with-prometheus-and-grafana-441i
Dev To
More About this Source Visit Dev To