
An Interest In:
Web News this Week
- April 14, 2024
- April 13, 2024
- April 12, 2024
- April 11, 2024
- April 10, 2024
- April 9, 2024
- April 8, 2024
Some of Our Sources
- Techcrunch
- Web Designer Wall
- Just Creative
- TutsPlus - Design
- Vandelay Design
- Web Design Ledger
- CSS Globe
- 24 Ways
- Spyre Studios
- Design Modo
Help Webnuz
Referal links:
How to test the performance of your GraphQL applications?
We released a new feature in Escape that enables you to monitor the performance of your GraphQL application. Let's discover it!
Performance is at the heart of GraphQL security. But what makes an API perform poorly?
We found that 80% of all GraphQL endpoints scanned by Escape since its inception are vulnerable to Denial of Service (DoS) and Complexity attacks. That's a lot of APIs with performance problems!

GraphQL being a Query Language with user-supplied queries, an attacker can craft a request requiring a lot of resources for your server to process. All these requests have in common that they use little-known features of GraphQL.
DoS attacks are made more accessible by a GraphQL feature named aliasing. With GraphQL aliases, an attacker can call a resolver many times in the same query or mutation, bypassing HTTP-based rate limiting. Read more about this vulnerability and its remediations.
Another common cause of performance issues is the ability of clients to nest GraphQL queries and even make them deeply recursive. That happens when your graph contains self-referencing objects. (e.g., a user has friends, who also have friends, who also have friends, etc.) Attackers can abuse this feature to cause CPU or memory exhaustion. Learn how it works and how you can protect your API here.
Performance issues may also result from the infamous "N+1 problem" in GraphQL. For instance, imagine we want to fetch all users' applications' names. The endpoint will fetch all users first, then resolve subsequent applications sequentially to get their names. We, therefore, have 1 request for the users plus N requests for the applications, one for each user.
query { users { id email applications { name } }}If the underlying storage of the endpoint is a relational database, logs will look like this:
-- Fetch all usersSELECT * FROM users;-- Fetch applications for all users, sequentiallySELECT name FROM applications WHERE userId = 1;SELECT name FROM applications WHERE userId = 2;SELECT name FROM applications WHERE userId = 3;SELECT name FROM applications WHERE userId = 4;Last but not least, performance problems may also result from debug queries. As a developer, if you have a huge query that allows you to fetch most of your database, be sure to have at least two types of environments (dev and production), with debug queries disabled in production. We wrote two articles about best practices for the production environment: GraphQL Error Handling Best Practices for Security and When GraphQL Errors become a Security Issue.
Now, let's see about how Escape finds those vulnerabilities.
What does Escape do?
During the scan, Escape's scanner sends a custom header (X-Escape-Request-ID) with each request sent to your API endpoint. This lets us know when we sent it and when we received it. We call this request tracing. The scanner keeps track of all responses time and puts the concerning requests in a queue.
After the scan, we consume the queue synchronously to be sure the flagged requests outline performance problems in your app.
Let's take a look at the Escape platform for browsing performance issues found during a scan.
How to manage your performance issues?
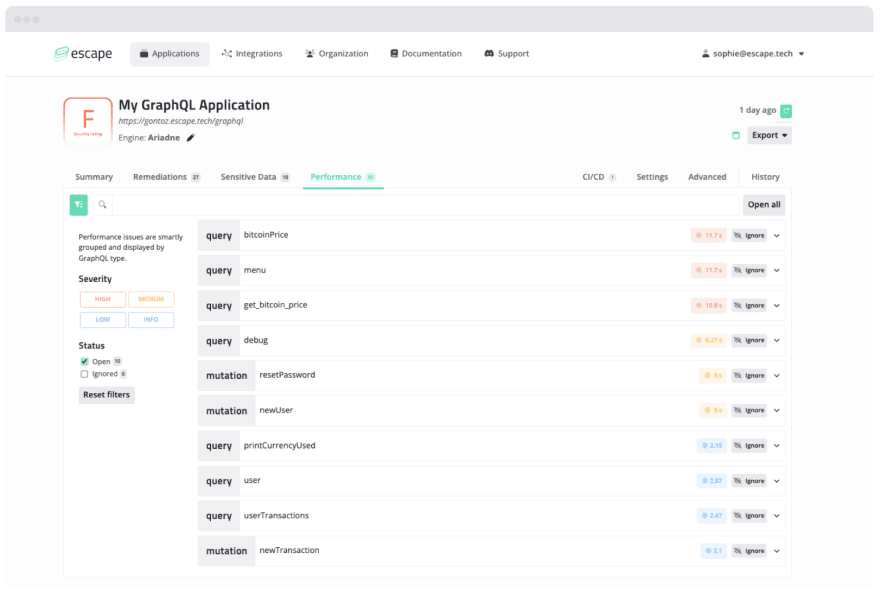
Here is the performance issues view of a scan run with Escape's GraphQL Security Scanner, which enables you to detect and fix your performance problem. Escape lists poorly performing queries and associates a severity score depending on the response time. A response time above 4 seconds is flagged as medium severity and above 10 seconds as high.
You can read our documentation about DOS and Complexity to learn more about security timeout.
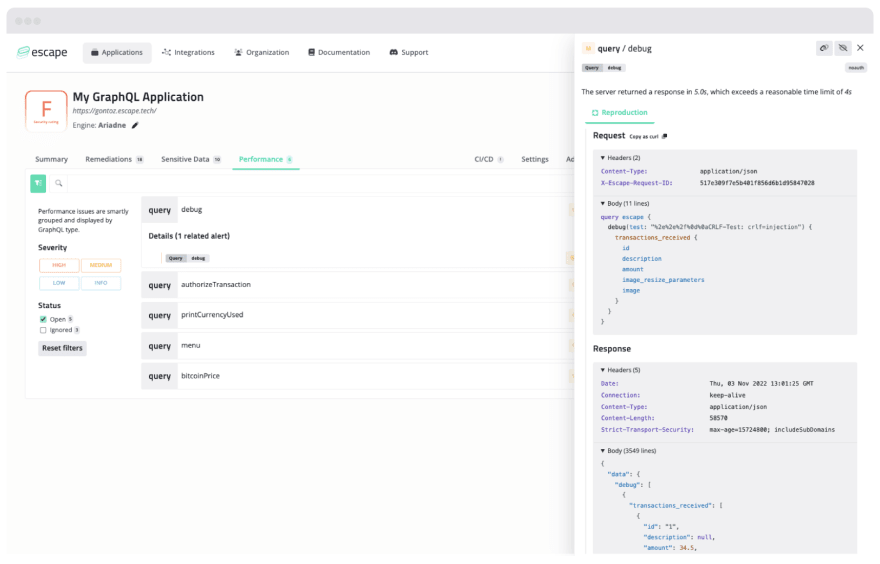
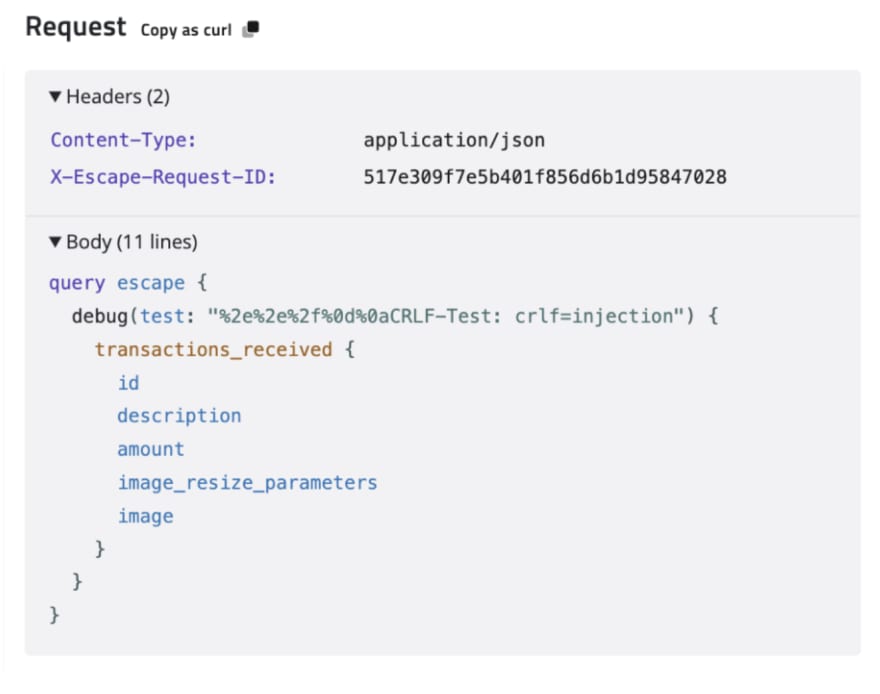
You can get more details by clicking on a performance vulnerability. For example, in the screenshot above, our scanner found that the debug query took 5 seconds to process, flagging the issue as medium. As a developer, you can see how to reproduce the request by copying the query and trying it yourself.
Want to secure your GraphQL application now? Try Escape for free
Original Link: https://dev.to/sophieboulaouli/how-to-test-the-performance-of-your-graphql-applications-2e5k
Dev To
More About this Source Visit Dev To