
An Interest In:
Web News this Week
- April 3, 2024
- April 2, 2024
- April 1, 2024
- March 31, 2024
- March 30, 2024
- March 29, 2024
- March 28, 2024
Some of Our Sources
- Mashable
- Crazy Leaf Design
- My Ink Blog
- Reencoded
- CSS Globe
- 24 Ways
- Wal You
- Freelance Switch
- Design Modo
- Web Resource Source
Help Webnuz
Referal links:
How to stay one step ahead of errors and downtime as you scale up yourbusiness
Hey, so you managed to scale your business from an early-stage startup to a fast-growing scale-up. This means your tech has grown a lot since. With an ever-growing system, how do you keep an eye on everything and make sure that it is all running and customers are not facing any downtimes or errors?
Well, we went through the same phase at FINN, growing from a 30 person startup in 2020 to 350+ people in 2022 and expanding to the US as well. This article presents some of my key learnings as to how to stay ahead of errors and downtimes.
The holy trinity when it comes to minimising downtimes and errors is logging, monitoring and alerting.
Logging
Simply speaking, logging is the act of keeping logs. Logs are entries of "events" happening in a system, for example: when did your system start, what's the hourly CPU utilisation, which user has logged in to the system, what requests were made to your API server, etc.
Why should youlog?
Why do we need logging? The answer is: visibility. We want to know what's going on in our system and we want our system to provide that information easily, rather than cracking our heads and making blind guesses as to what might have been the issue. To ensure this, it is our responsibility to make sure that we add proper log entries.
Logs can also be processed and aggregated to get metrics like requests per hour, response time, as well as interesting business insights, such as how many orders were created in a day or an hour.
What should youlog?
The key here is consistency. You should have a team-wide/organisation-wide agreement on what to log and ensure that it is adhered to when it comes to code. At FINN we have agree to have:
- Timestamp (time)-so we know when it happened
- Log level (level)-so we know what it's meant to express (error, warning, etc)
- Info about source (scope)-so we can find it in the source (name of the filename)
- Context-so we can investigate issues (e.g. the order ID)
- Message that tells us what happened in English (message)-so that we can read the logs. This is the usual log message.
- The version of the running service (v)-so that we can tell which version of our software logged the message and helps us debug against that specific version.
- Who is performing the action (actor)-This is important for auditing and traceability purposes. We can easily identify who asked our systems to perform a certain action.
It is also very important to make sure that any sensitive information is not logged, for example: credentials, Personally Identifiable Information (PII) such as names, email, phone numbers, social security number and so on. You can instead log something such as the ID which your system uses to identify a person or order. If you really need to log some of this information, use a hash so you can check for equality without logging it.
Another thing to keep in mind is to log only what you need. Logging too much will create noise and increase costs as you will need more log storage.
How should youlog?
How you log your data is also very crucial. For example, if you log everything in plain text, it will be very difficult to process and make meaning out of it. To make lives easier, always log in a format that can be parsed, such as JSON or XML. We chose JSON at our company because most logging libraries support it.
You must take advantage of using correct log levels. There are different levels of logs.
- error: Error logs are usually from unrecoverable errors. Things went wrong when we weren't expecting it. Some process failed and the system could not perform what it started, for example, if you wanted to save a file, but the write to your storage failed.
- warning: A warning indicates something went wrong, but the system survived and managed to complete the process it started. For example, if your system failed to send an email to the customer after order creation.
- info: This level of logging is used to keep track of informational metrics like a successful completion of a request, response times, etc.
- debug: Debug logs are used for logging things that can help you debug your system when things go wrong. It's a good practice to use debug logs to keep a track of your execution. You can log data every time you complete a step, for example when a user is authenticated, a user's profile is verified, a user's requested item is available, an order created successfully, an email sent to user.
Implementing what welearnt
Theories without examples and illustrations are boring.
I'll present our code in TypeScript to provide you with an example on how we implemented things, but it can be easily implemented in any other language as long as you stick to the principles:)
We used Winston as the logging library. We also implemented our own class on top of Winston logger to enforce our conventions.
Monitoring
Monitoring is keeping an eye on your systems, to see if everything is doing fine. The key to good monitoring is knowing what to monitor. Imagine monitoring a palace: you cant put security cameras just about anywhere. It will be too much to handle and will distract you from keeping an eye on the main stuff. Similarly in software, you have to know which parts matter the most: for example, the checkout process is very important for an e-commerce company.
Once you have identified the crucial parts, there are multiple ways to monitor them: health checks, end-to-end (E2E) tests and log-processing.
Health Checks
Health checks are the starting steps towards monitoring. A simple health check would be just checking if you can connect to your system from the outside world. During the execution of the health check, your system should try connecting to its dependencies, such as a database and report if every critical dependency is available and working. If not, then it should fail and you get to know that your system is having a failure.

End-to-end tests
Health checks are limited to testing one part of a system at a time, but fail to tell you if the whole system, comprised of multiple dependent components, works as a whole. Fixing that would be the end-to-end tests. They mock a human using the system as a whole, such as going through the checkout process to order a car. This tests everything, from the input components on the website, to the backend APIs handling user requests, to the storage that stores the order data. If any test fails, we know that the real user must be facing the same issues as well, and jump into action.
At FINN we use Checkly once again to run our scheduled E2E tests. Some teams also use a combination of Make and Apify to run scheduled E2E tests on smaller projects.
One thing I love the most about Checkly is that it allows you to write Monitoring as Code together with Terraform. Article linked at the end.
Processing logs
The previous two methods give you overall monitoring and monitoring on critical parts of the system, but not system-wide monitoring. This is where your logs come in place! If you logged errors, warnings and other information, you can process these logs and create beautiful dashboards to keep track of your systems, such as how many errors were logged per hour, how many warnings were logged in a day, number of requests served successfully, and so on.
If youre using the Serverless framework, using the Serverless Dashboard together with it makes things easier and provides you with ample monitoring to get started.

If you want to go pro, you can always use the mighty AWS CloudWatch and create your own dashboards. For example:
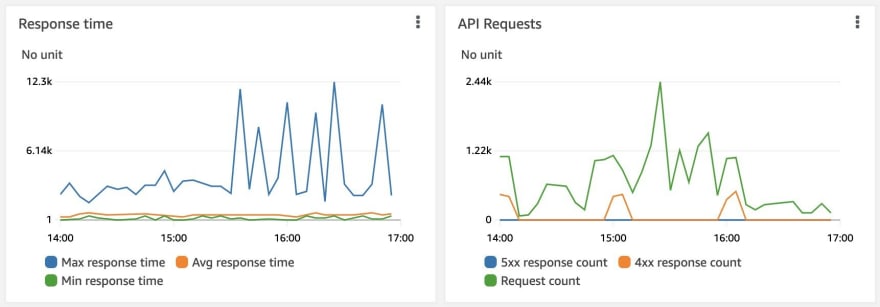
AWS CloudWatch also comes with powerful querying capabilities. To use these, head over to your CloudWatch console > Log Groups > Select your resource > Search Log Group.
CloudWatch is much too powerful to be described completely here. Please read AWS documentation on Pattern and Filter syntax to know more.
Alerting
Alerting exists so that you get informed about errors (and maybe warnings) as soon as they happen. Alerting basically is some automation that keeps an eye on your monitored metrics (such as 5xx errors, requests per time, 4xx errors, etc) and performs some action as soon as those metrics cross a pre-defined threshold.

Most of the teams at FINN have different alerting setups, the one pictured above is one of them. For non-critical incidents, posting on Slack is enough so that the team knows about it, and can solve the issue at their own pace. For critical money-making processes, however, we use Opsgenie, which has call escalation policies in places to ensure that critical incidents are responded to within a certain amount of time.
Conclusion
From an end-users perspective, one could say that logging, monitoring and alerting does not add much value, because they are not tangible features that the user can see/use. But oh boy they are so important in maintaining good user experience. Imagine how bad it would look if your customers have to call and notify you that a feature is not working.
No system is 100% error-free. Rather than trying to predict all the things that can go wrong (which I think becomes a waste of time after some point) and coming up with counter-measures, a better approach IMO is to embrace the errors, be ready and have systems in place to notify you as soon as they happen.
Please add your thoughts/opinions in the comments below. Would love to know how you are tackling this in your team/organisation.
Lets Connect!
If you liked this article, giving it a clap and sharing it with others would help a lot!
If you would like to read more on topics such as this, including software engineering, productivity, etc, consider following me! Much appreciated.
Connect with me on LinkedIn, or on Twitter, Im always happy to talk about tech, architecture and software design.
Original Link: https://dev.to/finnauto/how-to-stay-one-step-ahead-of-errors-and-downtime-as-you-scale-up-your-business-lmm
Dev To
More About this Source Visit Dev To