
An Interest In:
Web News this Week
- April 19, 2024
- April 18, 2024
- April 17, 2024
- April 16, 2024
- April 15, 2024
- April 14, 2024
- April 13, 2024
Some of Our Sources
- Engadget
- Web Designer Wall
- Joshua Blankenship
- You The Designer
- Web Designer Depot
- Fudge Graphics
- Stylized Web
- Wal You
- Web Resource Source
- Willems Lab
Help Webnuz
Referal links:
Observable tutorial: Analyze data in a JavaScript-native data notebook
Over the last few months, the Observable team has celebrated the first anniversary of the Observable Plot charting library, introduced the Data Table Cell type, and supercharged SQL Cells with summary charts.
Let's see how data notebooks, built with Observable, can work with Cube and fetch data from the recently updated SQL API as well as the REST API.
What is Observable?
Observable is collaborative data canvas that has a few distinctive features compared to other modern data notebooks on the market:
- Observable implements the principles of interactive and reactive data exploration popularized by Bret Victor in his visionary talks such as Inventing on Principle and Media for Thinking the Unthinkable.
- Observable is based on JavaScript which is not so common in the Python-dominated data notebooks space. Also, it natively works with Observable Plot, an open-source JavaScript library for visualization of tabular data based on D3.js. Not that surprising given that Observable is co-founded by Mike Bostock, the creator of D3.js.
- Observable provides a super-rich set of cell types as well as a complete library of tutorials and examples, templates, and notebooks contributed by a community of creators.
Observable notebooks run in the cloud and in your web browser. They can also be embedded as a whole and as individual blocks.
What is Cube?
Cube is the headless BI platform that sits between your data sources (e.g., data warehouses) and downstream data applications (e.g., data notebooks). Because of its position in the data stack, Cube is able to provide consistent metrics and performance for all your data flowing downstream.

Cube works with all modern data stores, creates a metrics layer with consistent metrics definitions, and delivers them downstream to any data notebook, application, or BI tool via its SQL, REST, or GraphQL APIs.
Extended connectivity. Observable natively supports fetching the data from an API and a number of databases: BigQuery, Snowflake, Postgres, and MySQL. With Cube, you can expand the range of available data sources to almost any data warehouse, query engine, or database (e.g., Athena, ClickHouse, Databricks, or Redshift).
Consistency for Data Explorers
One of the benefits of using Observable and Cube together is providing a common ground for all teams working together within an organization.
It's not uncommon that inconsistent data is being used across different teams within a company. It generally originates to varying metrics definitions across the many tools that each team uses. At some point, teams realize that they use different SQL queries to calculate metrics and, unfortunately, mislead their users with inconsistent insights, despite using the same data.
Lets go through a super high-level example. Imagine both the product and customer success teams want to calculate product success "over the last year". The product team queries the 2021 data (01/01/2021 to 12/31/2021), whereas customer success queries it as year-over-year (06/01/2021 to 06/01/2022).
Since the data pipelines of both teams are siloed, neither team necessarily has visibility into how the other defined the query; its likely these teams use different tools too. This discrepancy in query results can absolutely misalign the teams working towards a single goal, but working off of disparate data.
In case of Cube used upstream of Observable notebooks and all other data applications, a misalignment has no chance to happen. Cube will deliver consistent metrics via its various APIs to all tools.
Defining Consistent Metrics
Lets see how Cube complements Observable in the data pipeline. In this example, well use a e-commerce dataset and build a data model around it. Well also customize the data model to demonstrate how Cube helps maintain and evolve metrics definitions.
Running Cube. To keep things simple and save time, we'll run fully managed Cube in Cube Cloud. Please proceed to Cube Clouds sign up page and follow along the instructions to connect your own data source and generate a data model.
For convenience, you can also use the following credentials to get up and running in no time:
Hostname: demo-db-examples.cube.devPort: 5432Database: ecomUsername: cubePassword: 12345This is what your deployment in Cube will look like:
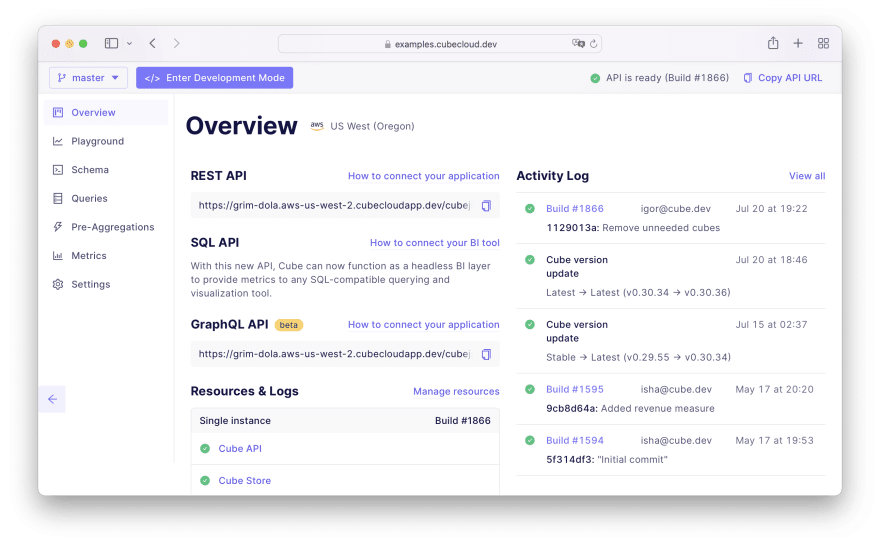
Defining the data model. To see the data model you created above, navigate to the Schema tab. You will see files named LineItems.js, Orders.js, Users.js, etc. under the schema folder which defines the cubes in your data model.

Key ideas on what were seeing above:
- The cube is a logical entity that groups measures (quantitative data) and dimensions (qualitative data) together into metrics definitions.
- In this case, we have defined a cube over the entire
public.line_itemstable. - Measures are defined as aggregations (e.g. count, sum, etc.) over columns in the table.
- Dimensions are defined over textual, numeric, or temporal columns in the table.
- You can define complex measures and dimensions with custom SQL statements and references to other measures and dimensions.
Customizing the data model. We'll define a completely new rolling window measure in the data model.
Lets assume you want to calculate the total revenue brought in from sold line items over all time. This can be done by writing a SQL query in your local Jupyter notebook or any other BI tool you may be using. But what happens if you want to observe the total revenue over different time granularities? Or add another dimension to observe the revenue data?
This is where your LineItems cube can be modified to abstract away your varied data requests. Simply define the metrics in your data model once, and then use them time and again across teams to achieve your business goals.
For this example, well customize the data model in the cloud by adding the "total revenue" as a measure to the LineItems cube.
// A rolling window measurerevenue: { sql: `price`, type: `sum`, rollingWindow: { trailing: `unbounded`, },}While Cube Cloud has a ton of time-saving features, we'll use a particularly useful one now. Click on Enter Development Mode to unlock the schema files for modifications. This essentially creates a development environment (or "branch") where you can make changes to the data model.
The following code snippet shows the contents of the LineItems.js file (which defines the metrics for the LineItems cube) with the revenue rolling window measure added to the measures section.
Navigate to the LineItems.js file and replace its contents with the snippet below.
cube(`LineItems`, { sql: `SELECT * FROM public.line_items`, joins: { Products: { sql: `${CUBE}.product_id = ${Products}.id`, relationship: `belongsTo` }, Orders: { sql: `${CUBE}.order_id = ${Orders}.id`, relationship: `belongsTo` } }, measures: { count: { type: `count`, drillMembers: [id, createdAt] }, quantity: { sql: `quantity`, type: `sum` }, price: { sql: `price`, type: `sum` }, // A rolling window measure revenue: { sql: `price`, type: `sum`, rollingWindow: { trailing: `unbounded`, } } }, dimensions: { id: { sql: `id`, type: `number`, primaryKey: true }, createdAt: { sql: `created_at`, type: `time` } }});Click Save All to apply the changes to the development version of your API. Lastly, click Commit & Push to merge your changes back to the main branch. You will see your changes deployed in the Overview tab.
Awesome! Youve just built a customized data model to suit your project. The next part involves bringing your data to Observable.
Connecting Observable to Cube
Cube offers three different APIs to deliver data (SQL, REST, and GraphQL) to downstream applications. SQL API and REST API are both fine options to access Cube from Observable notebooks, with their own pros and cons.
Using SQL API
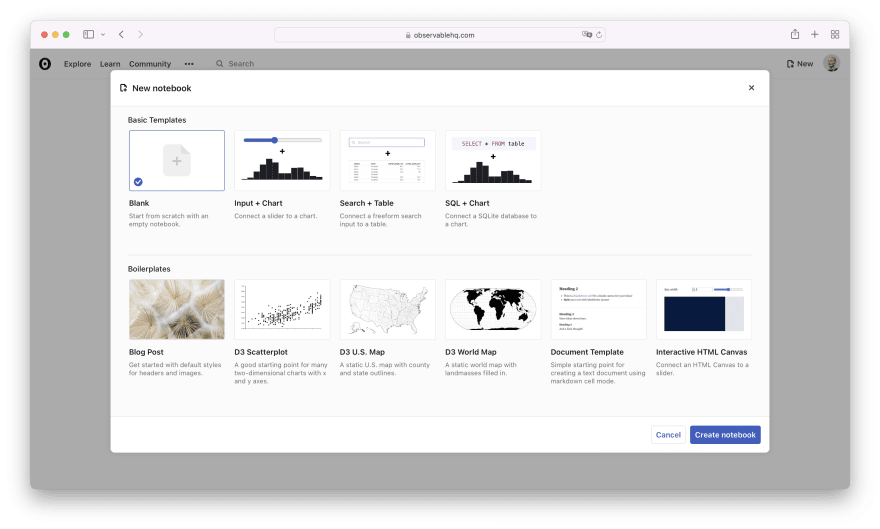
Obviously, the very first step is to sign up for an Observable account if you don't have one already. Then, let's create a new blank notebook:
To read data from the SQL API, we need to add the Database query cell:

After adding the cell, click Select a database... and then + Create database to navigate to the Databases page in Settings:
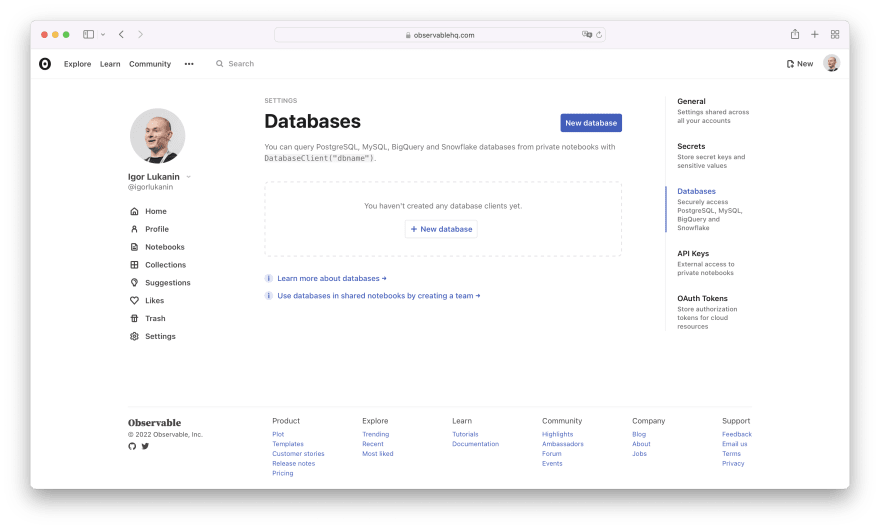
On that page, click on + New database and then navigate back to Cube Cloud for a second. On the Overview tab, click on Deploy SQL API to generate your credentials:
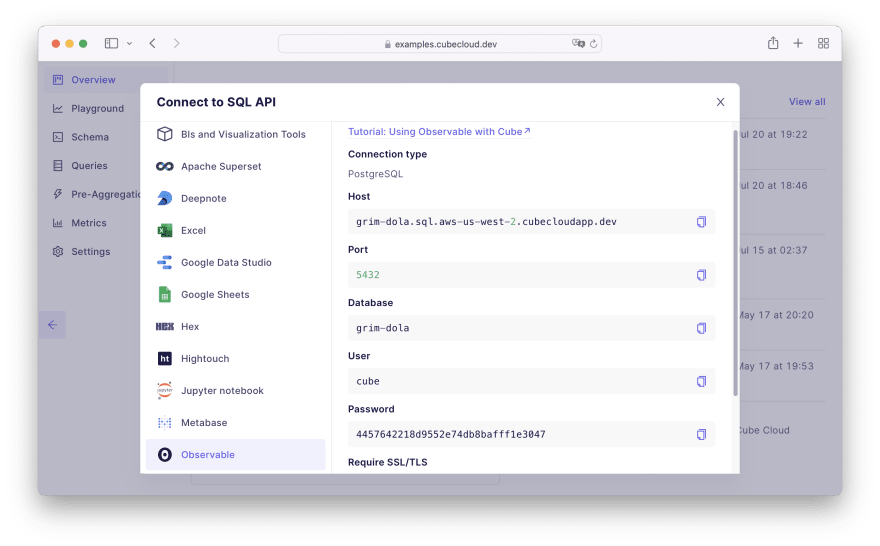
You can then enter these credentials to the New database popup in Observable. For convenience, you can also use the following credentials:
Host: grim-dola.sql.aws-us-west-2.cubecloudapp.devPort: 5432Database: grim-dolaUsername: cubePassword: 4457642218d9552e74db8bafff1e3047
Now you can navigate back to your notebook and select Cube from the dropdown in your Database query cell:

Now you can run queries against the SQL API:

It's worth noting that there's another cell type called Data table which is very convenient. Similar to Database query, you can select Cube as the database. However, you don't need to write the SQL by hand. You can proceed by selecting a table, representing to a cube in your data model:

Then, you can filter, pick select measures and dimensions, sort, and slice the data. Observable will generate the SQL for you under the hood:

To visualize the data, you should give the cell a name (e.g., orders_by_date) and select from a plethora of available chart types:

If needed, you can also apply a last-mile transformation with JavaScript:
orders_by_date_t = orders_by_date .map(e => ({ ...e, count: parseInt(e.count) }))Then, you would probably pick and customize one of the many Observable Plot snippets:

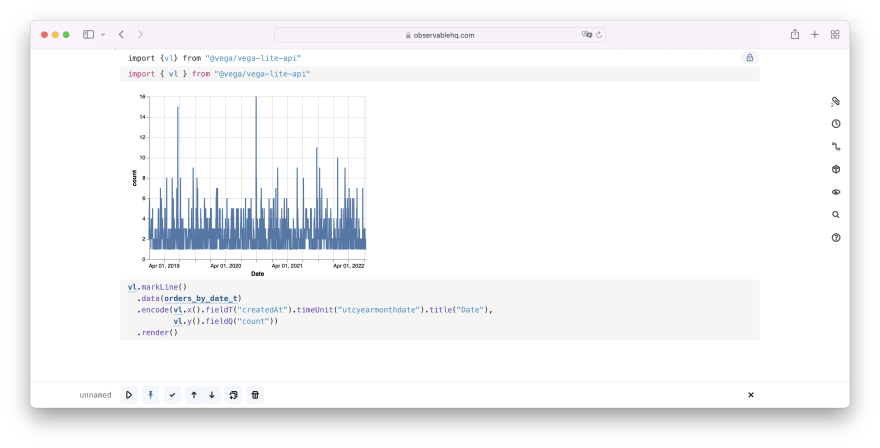
Plot.plot({ marks: [ Plot.ruleY([0]), Plot.lineY(orders_by_date_t, {x: "createdAt", y: "count"}) ]})Alternatively, you can import and use Vega-Lite library which is widely popular and used by thousands of data enthusiasts:
import {vl} from "@vega/vega-lite-api"vl.markLine() .data(orders_by_date_t) .encode( vl.x().fieldT("createdAt").timeUnit("utcyearmonthdate").title("Date"), vl.y().fieldQ("count").title("Count") ) .render()If you'd like to get inspiration for more advanced data visualizations that you can build with Observable, check out the available templates and featured works by the Observable community. Also, consider diving deep into Observable Plot library, the Swiss knife of data visualization in Observable.
Using REST API
Now let's see how you can also read data from the REST API. First, we need to add the generic JavaScript cell:

Then, let's navigate back to Cube Cloud. On the Overview page, we can copy the endpoint URL for the REST API:

Here's what I've copied from my Cube Cloud deployment:
https://awesome-ecom.gcp-us-central1.cubecloudapp.dev/cubejs-api/v1You'll also need to generate a long-lasting JSON Web token. (If you need a hand, pleae check the Cube docs on JWT generation.) Here's what I've generated for my deployment:
eyJhbGciOiJIUzI1NiIsInR5cCI6IkpXVCJ9.eyJpYXQiOjEwMDAwMDAwMDAsImV4cCI6NTAwMDAwMDAwMH0.OHZOpOBVKr-sCwn8sbZ5UFsqI3uCs6e4omT7P6WVMFwNow we're ready to insert this code snippet in the JavaScript cell:
orders_over_time = fetch("https://awesome-ecom.gcp-us-central1.cubecloudapp.dev/cubejs-api/v1/load", { method: 'POST', headers: { 'Authorization': 'Bearer eyJhbGciOiJIUzI1NiIsInR5cCI6IkpXVCJ9.eyJpYXQiOjEwMDAwMDAwMDAsImV4cCI6NTAwMDAwMDAwMH0.OHZOpOBVKr-sCwn8sbZ5UFsqI3uCs6e4omT7P6WVMFw', 'Content-Type': 'application/json' }, body: JSON.stringify({ query: { measures: ['Orders.count'], timeDimensions: [{ dimension: 'Orders.createdAt', granularity: 'month' }] } }) }) .then(response => response.json()) .then(json => json.data) .then(data => data.map(e => ({ count: parseInt(e["Orders.count"]), createdAt: d3.utcParse(e["Orders.createdAt.month"]) })))Let's highlight a few things here:
- We need to append
/loadto your API URL specified as afetchargument. - We need to add the token next to the
Bearerpart of theAuthorizationheader. - We need to put the Cube query inside the
JSON.stringifycall.
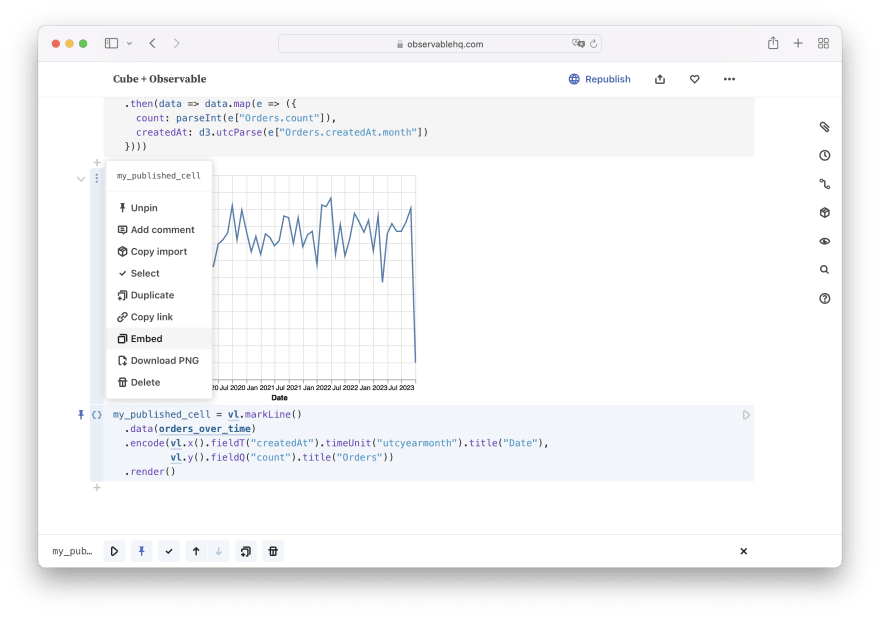
It's enough to make an API call and fetch the data. In a similar fashion, here's how you can visualize the data with Vega-Lite:
my_published_cell = vl.markLine() .data(orders_over_time) .encode(vl.x().fieldT("createdAt").timeUnit("utcyearmonth").title("Date"), vl.y().fieldQ("count").title("Orders")) .render()Choosing an API to use
You should pick an API with these pros and cons in mind:
Cube SQL API:
- allows to use Database query cells where you can write concise SQL queries
- allows to use Data table cells where you can compose queries in the UI
- requires a separate service to set up multitenancy and fetch security context
- won't work in published Observable notebooks on a free plan (Observable turns database connections off after a notebook on a free plan is published)
Cube REST API:
- requires to use JavaScript cells to write the code to fetch the data which can sometimes get overly verbose
- allows to pass security context in a JSON Web Token for multitenancy
- will work in published Observable notebooks on a free plan
However, since Observable has very sound pricing plans, compatibility with published notebooks should not be a sole deciding factor here.
Embedding Observable notebooks
Observable provides a very rich set of embedding options, far exceeding what other data notebooks provide in terms of customizability.
Notebook. Obviously, you can publish the entire notebook by clicking Publish... on the top of your notebook.

For instance, you can browse the published notebook that we've built during this tutorial. (Note that cells using the SQL API don't work because the notebook is owned by an account on the free plan.)
Cells. You can publish an individual cell or a set of cells as well. An interesting quirk is that you can only publish a cell if it has a name: to do that for JavaScript cells, assign the contents to a variable. Then, you can click Embed in the dropdown menu:
You are free to choose whether you're publishing all cells in the notebook, a subset of cells, or just a single one:

Then, you have to choose between several powerful embedding options:
- Iframe will give you a code snippet that you can Copy and embed into any HTML document, including a page in your content management system like Gatsby or even another Observable notebook. Wrapped into an
iframetag, the code and styles of embedded content are fully isolated from your application. - With Iframe, you can also Copy URL only and paste it into environments that support the oEmbed standard, e.g., Notion, Medium, or Reddit.
- Runtime with JavaScript will give you a code snippet that you can embed into an HTML document as well. The difference is that it will load a tiny JavaScript library and render the cell in place, giving you the freedom to customize how the cell is styled and displayed.
- Runtime with React works similarly, the only difference is that your cell is represented as a React component. If you're building a React app, it's the most native way to embed a cell into it.

Wrapping up
If you've picked Observable as your data notebook of choice, consider using it with Cube. It will provide consistent metrics for your data analysis and data apps you'll build and publish.
Would you like to learn more about Cube? Check the documentation and create a free Cube Cloud account today.
Also, please feel free to join our community of more than 6000 developers and data engineers on Slack, drop us a line, or give Cube a star on GitHub. Good luck!
Original Link: https://dev.to/cubejs/observable-tutorial-analyze-data-in-a-javascript-native-data-notebook-1oh
Dev To
More About this Source Visit Dev To