
An Interest In:
Web News this Week
- April 25, 2024
- April 24, 2024
- April 23, 2024
- April 22, 2024
- April 21, 2024
- April 20, 2024
- April 19, 2024
Some of Our Sources
- Smashing Magazine
- Abduzeedo
- Vandelay Design
- Naldz Graphics
- Noupe
- Web Design Ledger
- Specky Boy
- Codrops
- Hashedout
- The Verge
Help Webnuz
Referal links:
YugabyteDB cardinality estimation in the absence of ANALYZE statistics
TL;DR: there's a summary with keywords in bold at the end
YugabyteDB uses PostgreSQL query planner, which is a cost-based optimizer. As of version 2.15 the ANALYZE is still in beta and query planner relies on some heuristics for tables with no statistics. Seasoned Oracle DBAs would call that RULE-based optimizer. Sounds too simplistic? Remember that YugabyteDB is optimized primarily for OLTP and, in the critical OLTP workloads, you don't want an optimizer that is too creative.
I'll quickly compare with two databases, one SQL, Oracle Database, and one NoSQL, DynamoDB, to explain that having the access path dependent on rules may be a good feature. The major OLTP softwares I've seen running on Oracle were using RULE or, because this one is deprecated for a long time, an equivalent by tweaking some cost adjustments to force indexes and nested loops, whatever the cardinality estimation is.
With DynamoDB the lack of an intelligent cost-based optimizer is what developers actually appreciate. The cost of the query depends only on the type of query: Scan, Query or Get. If you are familiar to DynamoDB, you can translate shard/sharding used in this post to partition/partitioning, used in NoSQL databases. We need to be precise on the terms because, on top of the sharding distribution, YugabyteDB adds the PostgreSQL declarative partitioning to control the geo-distribution or help lifecycle management.
The YugabyteDB heuristics are very similar and I'll describe them with the same idea. Those are in yb_scan.c and I'll mention the constants used there.
I'll run the examples on a simple table with a unique index on (a,b), which is actually the primary key, and a non-unique secondary index on (c,d)
drop table if exists demo;create table demo ( a int, b int , primary key(a,b) , c int, d int, e int);create index demo_cd on demo(c,d);In the absence of ANALYZE statistics, YugabyteDB sets a default of one thousand rows (#define YBC_DEFAULT_NUM_ROWS 1000)
Table Scan
A full table scan reads all rows, the selectivity is the 100% (#define YBC_FULL_SCAN_SELECTIVITY 1.0) so the estimation is rows=1000
explain select * from demo; QUERY PLAN---------------------------------------------------------- Seq Scan on demo (cost=0.00..100.00 rows=1000 width=20)(1 row)A quick note about cost: the cost per tuple is YB_DEFAULT_PER_TUPLE_COST=10 multiplied by cpu_tuple_cost which defaults to 0.01, so 0.1 per tuple, with no startup cost. This explains cost=0.00..100.00 for rows=1000
Note that the predicates that are not on the key columns do not change the estimation here, because all rows are scanned anyway, even when the filtering is pushed down to the storage:
/*+ Set(yb_enable_expression_pushdown off) */explain select * from demo where d=1; QUERY PLAN---------------------------------------------------------- Seq Scan on demo (cost=0.00..102.50 rows=1000 width=20) Filter: (d = 1)(2 rows)/*+ Set(yb_enable_expression_pushdown on) */explain select * from demo where d=1; QUERY PLAN---------------------------------------------------------- Seq Scan on demo (cost=0.00..102.50 rows=1000 width=20) Remote Filter: (d = 1)(2 rows)In terms of DynamoDB calls, this would be a Scan. I'm comparing only the distributed access patterns here - everything else is different as YugabyteDB is distributed SQL, ACID across all nodes, whereas DynamoDB is distributed storage for NoSQL with per-partition consistency. In Oracle Rule Base Optimizer, this the latest choice (RBO Path 15: Full Table Scan)
Single Hash Query
The primary key has been defined as primary key(a,b) which is equivalent to primary key(a hash, b asc):
yugabyte=> \d demo Table "public.demo" Column | Type | Collation | Nullable | Default--------+---------+-----------+----------+--------- a | integer | | not null | b | integer | | not null | c | integer | | | d | integer | | | e | integer | | |Indexes: "demo_pkey" PRIMARY KEY, lsm (a HASH, b ASC) "demo_cd" lsm (c HASH, d ASC)This means that the table is sharded on ranges of yb_hash_code(a) to distribute the rows across the cluster. If a query filters on the hash part of a composite primary key, we can expect many rows, but less than the full table because this reads at most one shard.
The estimated cardinality for the heuristic cost model is 100 rows out of 1000 which brings the selectivity to 10% (#define YBC_HASH_SCAN_SELECTIVITY (100.0 / YBC_DEFAULT_NUM_ROWS)) so the estimation is rows=100:
explain select * from demo where a=1 ; QUERY PLAN-------------------------------------------------------------------------- Index Scan using demo_pkey on demo (cost=0.00..15.25 rows=100 width=20) Index Cond: (a = 1)(2 rows)In terms of DynamoDB calls, this would be a Query, reading a collection from a single partition. In Oracle Rule Base Optimizer, this the latest choice of access by index (RBO Path 10-11: Range Search on Indexed Columns)
Single Key Query
YugabyteDB secondary indexes are global and can be unique or not. Unique secondary index is the same as for the primary key. But with non-unique, there is the possibility to query on a full key that returns multiple rows.
The estimated cardinality for the heuristic cost model is between a unique key and a partial key, 100 rows out of 1000 which brings the selectivity to 1% (#define YBC_SINGLE_KEY_SELECTIVITY (10.0 / YBC_DEFAULT_NUM_ROWS)) so the estimation is rows=10:
explain select * from demo where c=1 and d=1; QUERY PLAN---------------------------------------------------------------------- Index Scan using demo_cd on demo (cost=0.00..5.25 rows=10 width=20) Index Cond: ((c = 1) AND (d = 1))(2 rows)In terms of DynamoDB this is still a Query. The difference is that in DDB you have to query the secondary index explicitly, with follower reads. In a SQL database, you mention the table and the query planner will access the index when it is faster, with strong consistency. In Oracle Rule Base Optimizer, this the latest choice of access by index (RBO Path 8-9: Indexes with equality)
Single Row Get
The previous case is for non-unique secondary indexes only because an equality predicate on key columns will return at most one row on a primary key.
The estimated cardinality is then 1 row out of 1000 which brings the selectivity to 0.1% (#define YBC_SINGLE_ROW_SELECTIVITY (1.0 / YBC_DEFAULT_NUM_ROWS)) so the estimation is rows=1:
explain select * from demo where a=1 and b=1; QUERY PLAN----------------------------------------------------------------------- Index Scan using demo_pkey on demo (cost=0.00..4.12 rows=1 width=20) Index Cond: ((a = 1) AND (b = 1))(2 rows)In terms of DynamoDB this would be a Get for a single item. But here, because it is SQL, you don't have to mention which index. Having an equality condition on the key columns go to the right structure. In Oracle Rule Base Optimizer, this the first choice when available (RBO Path 4: Single Row by Unique or Primary Key)
Why ANALYZE is still in beta in 2.15
Here is a summary of what we have seen:
yugabyte=> explain select * from demo; QUERY PLAN---------------------------------------------------------- Seq Scan on demo (cost=0.00..100.00 rows=1000 width=20)yugabyte=> explain select * from demo where a=1 ; QUERY PLAN-------------------------------------------------------------------------- Index Scan using demo_pkey on demo (cost=0.00..15.25 rows=100 width=20) Index Cond: (a = 1)yugabyte=> explain select * from demo where c=1 and d=1; QUERY PLAN---------------------------------------------------------------------- Index Scan using demo_cd on demo (cost=0.00..5.25 rows=10 width=20) Index Cond: ((c = 1) AND (d = 1))yugabyte=> explain select * from demo where a=1 and b=1; QUERY PLAN----------------------------------------------------------------------- Index Scan using demo_pkey on demo (cost=0.00..4.12 rows=1 width=20) Index Cond: ((a = 1) AND (b = 1))I mentioned that ANALYZE is in beta, and you will have a warning when using it. Let's add one million rows and ANALYZE:
yugabyte=> insert into demo select n,n,n,n,n from generate_series(1,1000000) n;INSERT 0 1000000yugabyte=> analyze demo;WARNING: 'analyze' is a beta feature!LINE 1: analyze demo; ^HINT: Set 'ysql_beta_features' yb-tserver gflag to true to suppress the warning for all beta features.ANALYZENow the cardinality estimation follow the formulas above, applying the selectivity calculated on 1000 rows, but now on 1000000 rows:
yugabyte=> explain analyze select * from demo; QUERY PLAN---------------------------------------------------------------- Seq Scan on demo (cost=0.00..100114.80 rows=1001148 width=20) (actual time=4.545..4064.165 rows=1000000 loops=1)yugabyte=> explain analyze select * from demo where a=1 ; QUERY PLAN-------------------------------------------------------------------------------- Index Scan using demo_pkey on demo (cost=0.00..11266.92 rows=100115 width=20) (actual time=0.815..0.817 rows=1 loops=1) Index Cond: (a = 1)yugabyte=> explain analyze select * from demo where c=1 and d=1; QUERY PLAN---------------------------------------------------------------------------- Index Scan using demo_cd on demo (cost=0.00..1255.43 rows=10011 width=20) (actual time=1.456..1.458 rows=1 loops=1) Index Cond: ((c = 1) AND (d = 1))yugabyte=> explain analyze select * from demo where a=1 and b=1; QUERY PLAN---------------------------------------------------------------------------- Index Scan using demo_pkey on demo (cost=0.00..119.13 rows=1001 width=20) (actual time=1.278..1.280 rows=1 loops=1) Index Cond: ((a = 1) AND (b = 1))This is correct for Seq Scan (100% selectivity) and maybe the other queries on partial key or full non-unique one. However, it over-estimates the unique key one, which always return one row. You may ask why using the 0.1% selectivity for it rather than a fixed value. The reason is that this rule applies to a list of columns, without looking at the predicate, and is also used for where a=1 and b>1 which is closer to a Single Key Query. That's the reason why ANALYZE is still in beta in 2.15 (preview branch): you may have side effects on cost estimations when joining other tables. The real use of ANALYZE'd tables comes when the selectivity estimation is based on column statistics. The model described above is simple and works for OLTP queries and some simple analytic ones. More complex queries may need some hints to get the right plan.
yb_enable_optimizer_statistics=on
In version 2.14 (the stable branch) that was released last week, you can ANALYZE your tables (still in beta) and set yb_enable_optimizer_statistics=on so that the cardinality estimation depends on the column statistics rather than the heuristics. I'll detail it in other posts, but, to show you that you can have accurate estimations, here is the same as above in 2.14: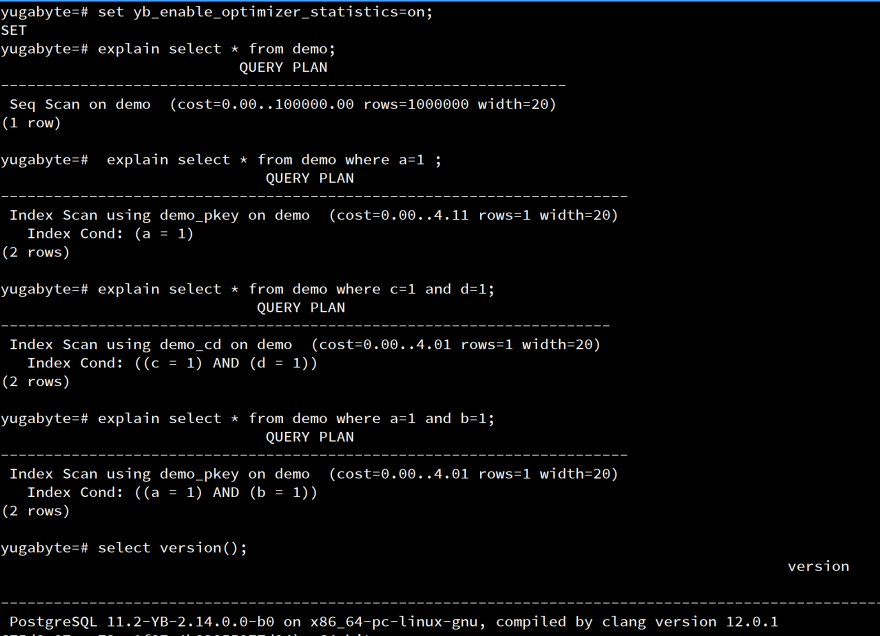
For my demo table, the estimations are exact because I have the unique value for all columns of a row. Then, a single-column estimate for an equality predicate is one. Without a unique value, the estimation would have been under the actual number because there are no statistics about the correlation between columns. This will be fixed with the support of CREATE STATISTICS.
It is just a model
Don't forget that the optimizer estimations are just a model to choose, at planning time, the join order, join methods and access paths for the execution. There will always be some execution context that can change the actual cost. The best to avoid issues with plan stability is to have a data model that fits the access patterns. This is the reason why I'm writing about those heuristics here, even if they are superseded with optimizer statistics in the next versions. Your data model should fit the following access patterns:
- Single Row Gets should all have a index starting with their columns, hash sharded. The main access pattern for point queries should be the primary key. It can read all columns with a single seek() in the LSM Tree. You can create unique secondary indexes for the others, and add in INCLUDE the columns you want to query without an additional hop to the table
- Single Key Queries which return many rows, should find their secondary index starting with the selective columns, HASH for equality predicates only, or ASC/DESC for ranges. This is where you should add the selected columns to the end of the index key, or in an INCLUDE, to make them covering indexes. Those queries read many rows: you don't want to add a remote call to the distributed table for each index entry.
- Single Hash Queries queries should not necessitate additional indexes, but use existing primary key or covering secondary indexes. Their columns must be first in the indexed column order.
- Table Scans are ok if you need most of the rows from one or more shards (aka tablets), and don't forget to enable
yb_enable_expression_pushdownto get filters pushed down to the storage. But if the selectivity is high, maybe you miss some range indexes on for those filters. Look at the filter predicates in the execution plan.
Original Link: https://dev.to/yugabyte/yugabytedb-cardinality-estimation-in-the-absence-of-analyze-statistics-1c1k
Dev To
More About this Source Visit Dev To