
An Interest In:
Web News this Week
- April 2, 2024
- April 1, 2024
- March 31, 2024
- March 30, 2024
- March 29, 2024
- March 28, 2024
- March 27, 2024
Some of Our Sources
- Team Treehouse
- Joshua Blankenship
- Spoon Graphics
- Naldz Graphics
- Crazy Leaf Design
- CSS Globe
- Wal You
- Web Resource Source
- Android Dissected
- TechPowerUp
Help Webnuz
Referal links:
Lambda Powertools TypeScript is Generally Available
I gave a first look at Lambda Powertools TypeScript back in January of 2022. I was pretty excited for the library at the time, but it came with an admonishment that it wasn't ready for production use. Well, the general availability announcement dropped July 15 so it's time for another look.
Table of Contents
- What's Changed?
- ES Modules Support
- Comparisons
- Logger
- Metrics
- Tracer
- Roadmap
- Conclusion
What's Changed
So what's changed in the beta? A glance at the CHANGELOG suggests the answer is that not very much has changed in six months. Lambda Powertools TypeScript still supports class decorators, middy, and a manual API. It still covers the core capabilities of logging, metrics and tracing, and no new capabilities have been added. Outside of some bug fixes and optimization, this is still very much the library I previewed back in January.
ES Modules Support
One change I might've liked to see is support for ES Modules. Interest in ES Modules has been growing quickly in the serverless community, driven largely by the desire to use by Top-Level Await.
Lambda Powertools TypeScript can't be used directly as an ES Modules dependency, but there is an issue open, so please consider adding your +1. For now, it's possible to get by with a require shim or via cjs tricks but it would be great to see native support for ES Modules in Lambda Powertools TypeScript.
Comparisons
Given that I've already gone over these modules in the prior post, I thought I'd instead compare the Lambda Powertools TypeScript modules to similar solutions. I'm looking at the API, the bundled script size, cold start and execution time. To gather metrics, I've written a little app using Step Functions that can run many instances of a function in parallel and capture the metrics.
My benchmarking tool will run each function 50 times aiming to achieve a 20% cold start rate. Code samples are available on GitHub.
Logger
The simplest way to log to CloudWatch from AWS Lambda is with console.log. Doing so adds no bloat to your function, there's no dependency management and writes to CloudWatch are asynchronous, so the operation is non-blocking. Many developers use libraries to guarantee logs are in a structured format and to control the verbosity of logging.
That said, we can use console as a baseline due to its simplicity. If we want a function that simply writes some unstructured logs, we can do something like this.
import type { APIGatewayProxyEventV2, APIGatewayProxyResultV2, Context,} from 'aws-lambda';export const handler = async ( event: APIGatewayProxyEventV2, context: Context): Promise<APIGatewayProxyResultV2> => { console.log('event: ', event); console.log('context: ', context); return { statusCode: 200 };};Logging out the event yields the stringified context object:
2022-07-19T12:10:45.503Z 2abe532e-2b26-46b5-9a65-884363160556 INFO context: { callbackWaitsForEmptyEventLoop: [Getter/Setter], succeed: [Function (anonymous)], fail: [Function (anonymous)], done: [Function (anonymous)], functionVersion: '$LATEST', functionName: 'LoggerConsole', memoryLimitInMB: '128', logGroupName: '/aws/lambda/LoggerConsole', logStreamName: '2022/07/19/[$LATEST]384dbd25ffeb4af49bc22c2ac4f333df', clientContext: undefined, identity: undefined, invokedFunctionArn: 'arn:aws:lambda:us-east-1:123456790:function:LoggerConsole', awsRequestId: '2abe532e-2b26-46b5-9a65-884363160556', getRemainingTimeInMillis: [Function: getRemainingTimeInMillis]}This is pretty noisy and having those succeed, fail and done methods doesn't offer a lot of value.
With Powertools we can inject a more useful context into log messages.
import { Logger } from '@aws-lambda-powertools/logger';import type { LambdaInterface } from '@aws-lambda-powertools/commons';import type { APIGatewayProxyEventV2, Context } from 'aws-lambda';const logger = new Logger();class Lambda implements LambdaInterface { @logger.injectLambdaContext({ logEvent: true }) public async handler( _event: APIGatewayProxyEventV2, _context: Context ): Promise<void> { logger.info('Here is some info!'); }}export const myFunction = new Lambda();export const handler = myFunction.handler;Now we get structured logs.
{ "cold_start": false, "function_arn": "arn:aws:lambda:us-east-1:123456790:function:LoggerPowertools", "function_memory_size": 128, "function_name": "LoggerPowertools", "function_request_id": "6eeaa0c9-e58f-45a7-bed2-a4b9d7e65d7e", "level": "INFO", "message": "Here is some info!", "service": "service_undefined", "timestamp": "2022-07-19T12:09:28.537Z", "xray_trace_id": "1-62d69ef6-dfdbc4be0f59a76c57c52cf8"}This is going to be much easier to search and doesn't include useless stringified methods. Plus we get a cold_start boolean tossed in.
For the sake of comparison, I threw in another implementation of the function using the popular and enduring winston library. Let's see how they did.
| Function | Avg Cold Start | Avg Duration | Code Size |
|---|---|---|---|
| LoggerConsole | 137.24 | 1.63 | 771 |
| LoggerPowertools | 157.58 | 1.86 | 78550 |
| LoggerWinston | 184.17 | 1.62 | 233142 |
The no-dependencies version is always going to be the fastest. Powertools adds around 78kb while winston is much heavier at 232kb. In either case we're not adding a lot of latency, but Powertools is smaller and thus faster and it gives us that cold_start metric.
Metrics
Often when it comes to metrics, we think about CPU, latency and other operational metrics and AWS services usually provide those out of the box. This kind of thinking can be flawed when we end up having to use 3rd parties such as google analytics to infer critical business events. A simpler solution is to have the application emit a metric when a business event (say a customer signup) occurs. We have a few options for doing this: We can use aws-sdk, we can use the aws-embedded-metrics lib and now we can use Powertools Metrics. Which is the best? Let's see.
To baseline this, let's use a function that doesn't emit metrics.
import type { APIGatewayProxyEventV2, Context } from 'aws-lambda';export const handler = async ( _event: APIGatewayProxyEventV2, _context: Context): Promise<void> => { const workflowSuccess = Math.random() > 0.5; if (workflowSuccess) { console.log('The workflow was successful!'); } else { console.log('The workflow failed.'); }};To understand whether or not our workflow is successful, we'll need to query logs. Ugh!
Let's try emitting metrics using the @aws-sdk/client-cloudwatch library from aws-sdk-v3.
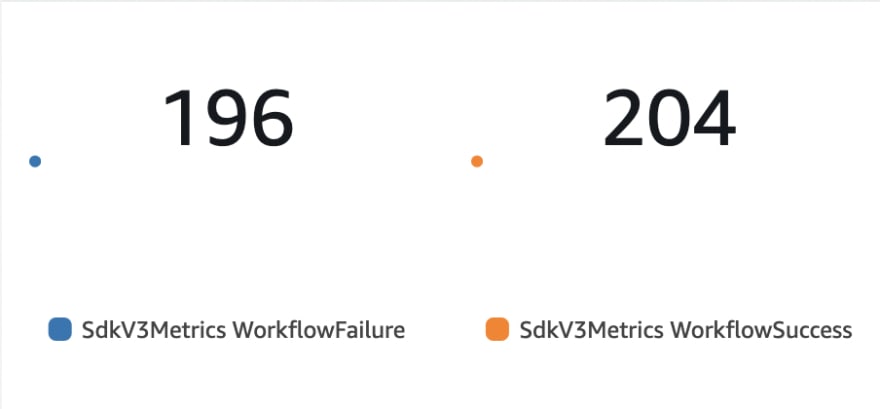
import { CloudWatchClient, MetricDatum, PutMetricDataCommand,} from '@aws-sdk/client-cloudwatch';import type { APIGatewayProxyEventV2, Context } from 'aws-lambda';const client = new CloudWatchClient({});export const handler = async ( _event: APIGatewayProxyEventV2, _context: Context): Promise<void> => { const workflowSuccess = Math.random() > 0.5; let metric: MetricDatum; if (workflowSuccess) { console.log('The workflow was successful!'); metric = { MetricName: 'WorkflowSuccess', Value: 1, Unit: 'Count' }; } else { console.log('The workflow failed.'); metric = { MetricName: 'WorkflowFailure', Value: 1, Unit: 'Count' }; } const command = new PutMetricDataCommand({ MetricData: [metric], Namespace: 'SdkV3Metrics', }); await client.send(command);};Now we have some nice metrics in CloudWatch!
The downside of using aws-sdk for this is that it relies on API calls and is somewhat slow. We can try to achieve the same thing using aws-embedded-metrics. How is this different from Cloudwatch custom metrics? It's better and fellow Community Builder Vishnu Prassad can tell you why.
import { createMetricsLogger, Unit } from 'aws-embedded-metrics';import type { APIGatewayProxyEventV2, Context } from 'aws-lambda';export const handler = async ( _event: APIGatewayProxyEventV2, _context: Context): Promise<void> => { const workflowSuccess = Math.random() > 0.5; const metrics = createMetricsLogger(); metrics.putDimensions({ Service: 'EMF' }); if (workflowSuccess) { metrics.putMetric('WorkflowSuccess', 1, Unit.Count); } else { metrics.putMetric('WorkflowFailure', 1, Unit.Count); } await metrics.flush();};In addition to having the advantage of EMF, the code is a bit more concise.
import { LambdaInterface } from '@aws-lambda-powertools/commons';import { Metrics, MetricUnits } from '@aws-lambda-powertools/metrics';import type { APIGatewayProxyEventV2, Context } from 'aws-lambda';const metrics = new Metrics({ namespace: 'Workflow' });class Lambda implements LambdaInterface { @metrics.logMetrics() public async handler( _event: APIGatewayProxyEventV2, _context: Context ): Promise<void> { const workflowSuccess = Math.random() > 0.5; if (workflowSuccess) { metrics.addMetric('WorkflowSuccess', MetricUnits.Count, 1); } else { metrics.addMetric('WorkflowFailure', MetricUnits.Count, 1); } }}export const myFunction = new Lambda();export const handler = myFunction.handler;The Powertools version is just a tad more verbose due to the need to use class decorators, but still not bad. In the end we'll care more about performance, so let's run those numbers.
| Function | Avg Cold Start | Avg Duration | Code Size |
|---|---|---|---|
| MetricsNone | 135.25 | 0.93 | 826 |
| MetricsEMF | 146.75 | 1.33 | 29456 |
| MetricsSDKV3 | 225.37 | 32 | 257026 |
| MetricsPowertools | 141.3 | 1.33 | 7942 |
I might've thought the Powertools implementation here would wrap aws-embedded-metrics, but obviously not! Although the actual performance benefit of Powertools over aws-embedded-metrics is marginal, you really have to appreciate how they've kept the size down.
Tracer
In the case of the Tracer module, it actually does wrap the aws-xray-sdk. So why would we use Tracer instead? If the API is nicer and it's not adding much in the way of latency, it could be worth it. Here's an example of using aws-xray-sdk. In this case the Lambda Function is tracing a separate function as well as an SDK call to (somewhat uselessly) get function properties.
import { GetFunctionCommand, GetFunctionCommandOutput, LambdaClient,} from '@aws-sdk/client-lambda';import { captureAsyncFunc, captureAWSv3Client } from 'aws-xray-sdk-core';import type { Context } from 'aws-lambda';const client = new LambdaClient({});captureAWSv3Client(client);const getFunction = async ( context: Context): Promise<GetFunctionCommandOutput> => { const command = new GetFunctionCommand({ FunctionName: context.functionName, }); return client.send(command);};export const handler = ( _event: unknown, context: Context): Promise<GetFunctionCommandOutput> => captureAsyncFunc('methodWithCustomTrace', async (subsegment) => { const fn = await getFunction(context); subsegment?.close(); return fn; });That captureAsyncFunc part is a bit awkward. How does Powertools do this?
import { LambdaInterface } from '@aws-lambda-powertools/commons';import { Tracer } from '@aws-lambda-powertools/tracer';import { GetFunctionCommand, GetFunctionCommandOutput, LambdaClient,} from '@aws-sdk/client-lambda';import type { Context } from 'aws-lambda';const client = new LambdaClient({});const tracer = new Tracer({ serviceName: 'powertoolsTracer' });tracer.captureAWSv3Client(client);class Lambda implements LambdaInterface { @tracer.captureMethod() public async methodWithCustomTrace( context: Context ): Promise<GetFunctionCommandOutput> { const command = new GetFunctionCommand({ FunctionName: context.functionName, }); return client.send(command); } @tracer.captureLambdaHandler() public async handler( _event: unknown, context: Context ): Promise<GetFunctionCommandOutput> { return this.methodWithCustomTrace(context); }}export const handlerClass = new Lambda();export const handler = handlerClass.handler;I'm really starting to warm to class decorators for cases like this. Function decorators would be better, but as previously discussed, they don't currently exist in TypeScript.
| Function | Avg Cold Start | Avg Duration | Code Size |
|---|---|---|---|
| TracerXRay | 266.91 | 50.56 | 410514 |
| TracerPowertools | 265.42 | 48.25 | 417980 |
Checking the performance numbers, Powertools is extremely light, still weighing in at around 7kb and barely impacting performance at all. In this case, Powertools is slightly faster, but I suspect over the long run it's costing a couple of ms, so worth it for the devexp.
Roadmap
One final thing to consider when deciding whether to adopt Lambda Powertools is what features may be in store in the future. The more mature libraries Lambda Powertools Python and Lambda Powertools Java include a number of useful utilities that we may like to see in Lambda Powertools TypeScript. The overall Lambda Powertools Roadmap doesn't tell us very much other than pending dotnet and golang libraries, but we can drill down into TypeScript-specific issues and glimpse the immediate future. It looks like stability is still the main priority, but there are some interesting items like RFC: Testing Factories for AWS Data Objects in the leftmost column.
Community engagement and voting will no doubt help to drive the Powertools roadmap.
Conclusion
To me, this is a no-brainer. One of the challenges in writing Lambda is that many of our dependencies were not designed for Lambda. This library obviously was and the team obviously took care to deliver maximum value in a minimal package. These core utilities promote best practices in a way that is accessible and easy to use. Whether you're writing in TypeScript or JavaScript, you can enjoy good IDE support and a high-level API to implement logging, metrics and tracing in Lambda.
Original Link: https://dev.to/aws-builders/lambda-powertools-typescript-is-generally-available-1dm8
Dev To
More About this Source Visit Dev To