
An Interest In:
Web News this Week
- April 23, 2024
- April 22, 2024
- April 21, 2024
- April 20, 2024
- April 19, 2024
- April 18, 2024
- April 17, 2024
Some of Our Sources
- BoingBoing
- TutsPlus - Code
- The Logo Smith
- Six Revisions
- FanExtra - PSD
- Crazy Leaf Design
- Reencoded
- Line 25
- CSS Tricks
- Hashedout
Help Webnuz
Referal links:
How to get insights from our dataset without writing code?
Data scientist spend most of their time (about 50% to 80%) cleaning, preparing and organizing data.

There are many tools in the market to achieve this, however I'll show you one of the most powerful tools that I've ever seen.
Wellcome AWS Glue DataBrew
AWS Glue DataBrew
AWS Glue DataBrew is a new visual data preparation tool that makes it easy for data analysts and data scientists to clean and normalize data to prepare it for analytics and machine learning.
Why is so powerful ?
Because, you can clean, prepare and organize your data at scale only paying per amount of information and time spending.
Step by step using DataBrew to get insights
Prerequisites
- AWS Account
Create a bucket and upload your dataset

You can create a new bucket clicking here.
Once you create the bucket, you must to upload a dataset: this is the dataset which I'm using for this demo. Here
Set up the dataset on [DataBrew](https://us-east-
1.console.aws.amazon.com/databrew/home)
First we need to connect your Dataset to DataBrew
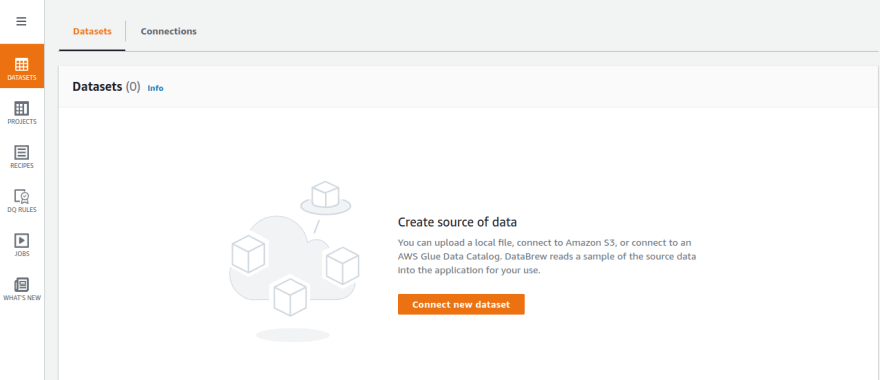
Here, you have different kind of ways to connect to your dataset. For this demo, we use Amazon S3.
Now, you have to select your S3 Bucket (that you created before) and select the dataset.

After that, click on Create
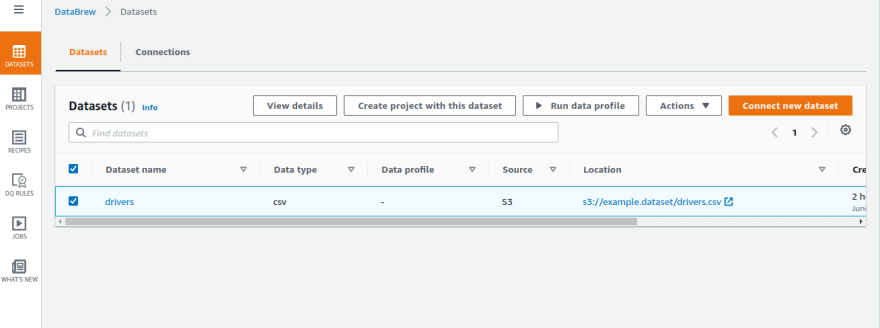
Run data profile
Once, you have your connection, select your dataset and click on Run data profile
There your are going to see, differents options like, number of rows that you want run the job, output file, etc.
At the end of the form, you are going to see a section named Permissions

There you must to select, Create new IAM role, fill the role name and click on Create and run job
Wait until the job finish
In the job section (Profile jobs), you'll see something like that:

When the job finish, click on View data profile and you'll see something like that:

Summary of the dataset and the correlation between variables
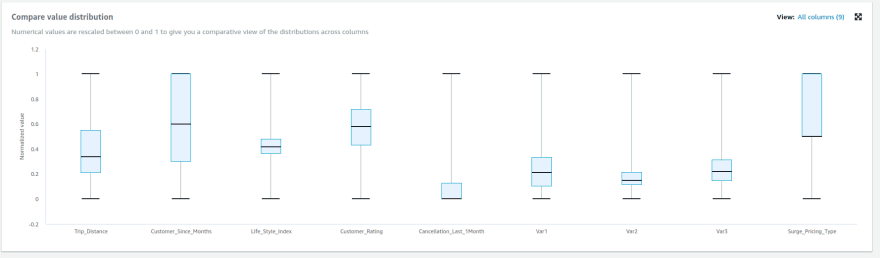
Value distribution
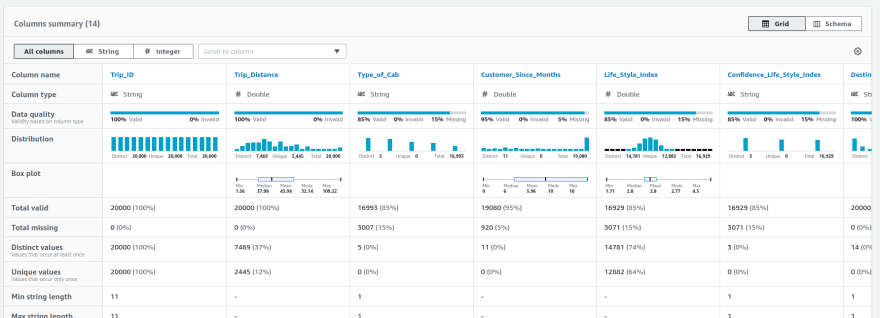
and columns summary!!
Well, there are much more insights that you can get with DataBrew, this is a short introduction.
Original Link: https://dev.to/bluetarget/how-to-get-insights-from-our-dataset-without-writing-code-25nb
Dev To
More About this Source Visit Dev To