
An Interest In:
Web News this Week
- April 2, 2024
- April 1, 2024
- March 31, 2024
- March 30, 2024
- March 29, 2024
- March 28, 2024
- March 27, 2024
Some of Our Sources
- BoingBoing
- The Logo Smith
- Smashing Apps
- Noupe
- Reencoded
- Freelance Switch
- Android Dissected
- Codrops
- Daily Now
- Hashedout
Help Webnuz
Referal links:
Prometheus vs Elasticsearch stack - Key concepts, features, and differences
Prometheus and the Elasticsearch stack are both used for monitoring applications. But while Prometheus is primarily meant to monitor metrics, the Elasticsearch stack or the ELK stack is mainly used to collect, store, analyze, and visualize application logs. In this article, we will see what Prometheus and ELK stack is and compare their differences.
Prometheus is a time-series metrics monitoring tool. Prometheus enables you to capture time-series data as metrics. These metrics can be aggregated to give insights into the behavior of your systems.
The Elasticsearch stack consists of three tools: Elasticsearch, Logstash, and Kibana. Combined together, these three tools form a popular log management platform.
Lets learn about both these tools in detail.
What is Prometheus?
Prometheus is an open-source metrics monitoring tool. It collects and stores metrics as time-series data (metrics that change over time). It is suited to monitor metrics both from traditional IT infrastructure as well as dynamic container environments. Its primary focus is on gathering, storing, and querying metrics.
What are metrics?
Metrics are measurements taken from an application or IT infrastructure that change over time. Examples could be error responses, service requests, response latency, CPU usage, memory usage, etc.
Prometheus provides a visualization layer called the Expression browser. But its quite basic in nature. Prometheus is often combined with Grafana, an open-source data visualization tool to provide richer dashboards.
Key Features of Prometheus
Some of the key features of Prometheus are:
Multi-dimensional data model
It stores data as time series (data that is tracked at an increment in time). You can also store an optional set of key-value pairs called labels for that metrics. The multi-dimensional data model enables rich contextual metrics monitoring.Query Language
Prometheus uses a query language called Prom QL to query the metrics data collected.Pull model data collection over HTTP
Data collection for Prometheus is pull-based. It pulls metrics from an application and exposes them in a format it understands on an HTTP endpoint. It provides client libraries in various programming languages to do(Go, Python, Ruby, etc.).Alert Manager
Prometheus comes with an alert manager that lets you create alerts on metrics. The alert manager also provides capabilities to group alerts in a single notification.Visualization layer
Prometheus comes with a basic visualization layer, but it can be combined with Grafana to create rich visualizations.
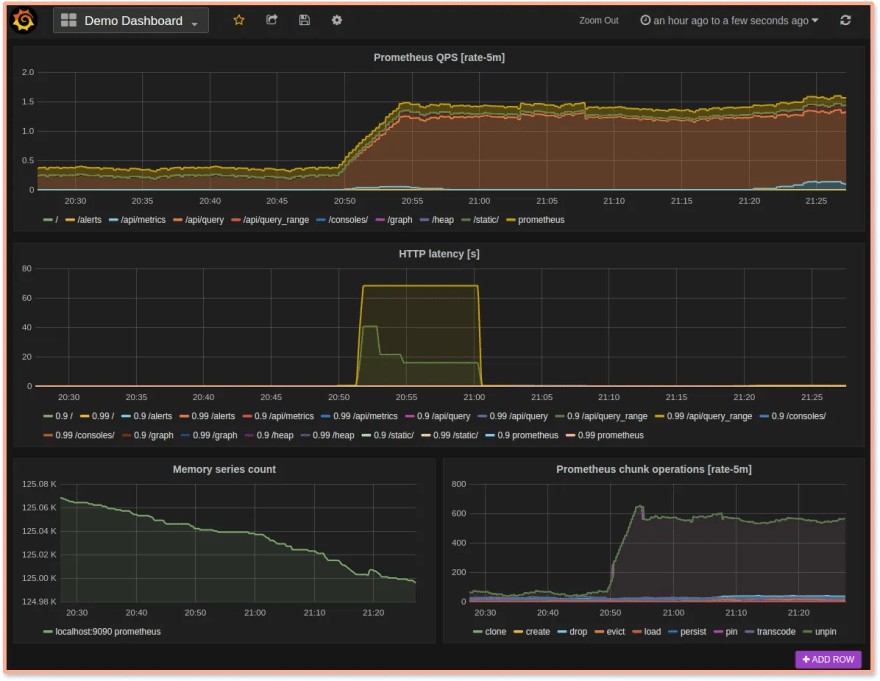 Prometheus Dashboard built using Grafana (Source: Prometheus website)
What is Elasticsearch stack?
The Elasticsearch stack or the ELK stack consists of three tools: Elasticsearch, Logstash, and Kibana. Together, they provide log management and analysis capabilities. All heres what the three tools do:
Elasticsearch
Elasticsearch is a NoSQL document-oriented database. But it is more popularly known as a search and analytics engine because of its extensive features on search capabilities.Logstash
Logstash is a log collector that helps you to collect, process, and transform log data. It can ingest data from multiple sources in both structured and unstructured formats and then parse it. Finally, it can send the filtered data to multiple destinations.Kibana
Kibana acts as the frontend of the Elastic stack and enables you to create visualizations from the data stored in the Elasticsearch database. With data querying and analysis features, Kibana lets you analyze your log data for insights. Some common charts are area charts, pie charts, heat maps, etc.
 The Elasticsearch stack
Key Features of Elasticsearch stack
Some of the key features of the Elasticsearch stack include:
Centralized Logging Capabilities
The ELK stack is capable of ingesting log data of different types and from different platforms, thanks to Logstash. Logstash can collect and parse a wide variety of data types. Log analysis at scale requires structured logging, and Logstash can transform unstructured logs to be sent for analysis. The ELK stack is also suited to collect logs from distributed environments.Full-text search
Elasticsearch is built on top ofApache Lucene, an open-source information retrieval software. Apache Lucene enables Elasticsearch can perform complex full-text searches using a single or combination of word phrases against its No SQL database.Real-time data analysis & visualization
The ELK stack provides you the capabilities to query real-time data and build dashboards with it. The real-time analysis capabilities enable engineering teams to react faster.Other use-cases
The Elasticsearch stack is not confined to log management and analytics. Although log management is its most popular use case, the ELK stack can also be used for security monitoring and analytics, business information analytics, etc.
Comparing Prometheus and Elasticsearch
Now that you have learned a bit about Prometheus and Elasticsearch lets have a look at their differences.
Monitoring use-cases
Prometheus is focused on metrics monitoring, whether that is from the application or the infrastructure. You can also set alerts based on these metrics. On the other hand, Elasticsearch is a popular log management tool. It can also take up other forms of data and provides capabilities to search and analyze it.
Getting Started
Prometheus is much easier to get started with as compared to the Elasticsearch stack. Learning and configuring the Elastic stack is a bit time-consuming.
Data Storage
Elasticsearch is a NoSQL database, and you can store your collected data in it. Elasticsearch also provides lots of search and query functionalities on its database. Prometheus provides a local time-series database, but it is not intended for long-term storage of monitoring data. Its local storage is limited to a single nodes scalability. For long-term storage, you need to configure Prometheus with a remote storage system.
Data Visualization
Prometheus provides basic data visualization capabilities with its in-built Prometheus expression browser. It is usually combined with Grafana, an open-source data visualization tool for providing more analysis and visualization capabilities.
The ELK stack uses Kibana for data visualization. As Kibana runs on top of the Elasticsearch stack, its UI is better suited for querying log messages, whereas Grafana is more suited for charts based on metrics monitoring like CPU usage, memory, disk, etc.
Self-hosted, Managed & Enterprise versions
Prometheus was initially developed at Soundcloud and was donated as open-source in 2012. Since then, it has been developed by the community. It is one of the graduated projects under the Cloud Native Computing Foundation(CNCF). If you want to use Prometheus, you can either self-host it or use one of the many managed services provided by different vendors.
Elasticsearch is managed by the company, Elastic. You can self-host the Elasticsearch stack or use the managed service provided by Elastic.
Open source and open code
Prometheus is released under Apache 2.0 license and is completely open-source. Elastic has changed the license of Elasticsearch and Kibana from Apache 2.0 to dual-licensed under the Elastic License and Server Side Public License (SSPL). This keeps the code open, but cloud providers cant provide managed services of Elasticsearch. Essentially, if you want to go for the ELK stack managed services, it is safer to choose Elastic.
A better alternative to Prometheus and Elasticsearch - SigNoz
Containerization and cloud computing has enabled things like continuous deployment and on-demand scaling. But it has also increased operational complexity. Troubleshooting such a complex software system requires all kinds of telemetry data such as logs, metrics, and traces.
Prometheus and the Elasticsearch stack are good tools for metrics monitoring and log analysis, respectively, but they fail to provide a complete picture of your software system. Without tracing, its challenging to correlate events in a distributed system.
SigNoz is a full-stack open-source application performance monitoring and observability tool that can be used for metrics, logs(under active development) as well as tracing.
SigNoz is built to support OpenTelemetry natively.OpenTelemetryis becoming the world standard for generating and managing telemetry data (Logs, metrics, and traces). It provides a fast OLAP datastore, ClickHouse, as the storage backend.
It comes with out-of-box application metrics charts.
 SigNoz UI showing application overview metrics like RPS, 50th/90th/99th Percentile latencies, and Error Rate
You can analyze tracing data with Flamegraphs and Gantt charts.
 Flamegraphs and Gantt charts in SigNoz dashbaord
Check out SigNoz GitHub repo:
Further Reading
Original Link: https://dev.to/signoz/prometheus-vs-elasticsearch-stack-key-concepts-features-and-differences-4h1d
Dev To
More About this Source Visit Dev To