
An Interest In:
Web News this Week
- April 2, 2024
- April 1, 2024
- March 31, 2024
- March 30, 2024
- March 29, 2024
- March 28, 2024
- March 27, 2024
Some of Our Sources
- Slashdot
- BoingBoing
- TutsPlus - Code
- Joshua Blankenship
- The Logo Smith
- Web Designer Depot
- FanExtra - PSD
- Noupe
- Reencoded
- Wal You
Help Webnuz
Referal links:
How to Make a Treemap in JavaScript
Treemap visualizations are widely used in hierarchical data analysis. If you need to build one but have never done that before, you might think the process is somewhat complicated. Well, not necessarily. I decided to make a step-by-step tutorial explaining how to create awesome interactive treemap charts with ease using JavaScript. And youre gonna love the illustrations!
Are we alone in the universe? A question every one of us has asked ourselves at some point. While we are thinking about the odds of the Earth being the only habitable planet in the universe, or not, one of the things we might consider is how big the universe is. Lets look at that with the help of treemaps! In this tutorial, we will be visualizing the scale of the 10 largest galaxies in the known universe using the treemapping technique.
So, would you like to know how to quickly build a JS-based treemap chart? Follow me in this stepwise tutorial and learn in an easy, fun way!
What Is a Treemap?
Before we get down to the tutorial itself, lets look at the concept of treemaps. A treemap chart is a popular technique for visualizing hierarchically organized, tree-structured data. Designed to show at a glance the structure of hierarchy along with the value of individual data points, it makes use of nested rectangles whose size is proportional to the corresponding quantities.
Each branch of the tree is a rectangle, and for sub-branches, there are smaller rectangles nested inside them. Displaying data by color and proximity, treemaps can easily represent lots of data while making efficient use of space and are great for comparing proportions within hierarchies.
The treemap chart type was invented by professor Ben Shneiderman who has given significant contributions in the field of information design and human-computer interaction. Treemaps are used in many data visualization areas and can be found applied in the analysis of stock market data, census systems, and election statistics, as well as in data journalism, hard drive exploration tools, etc.
A Peek at Our JS Treemap Chart
So now, we will build a treemap using JavaScript to compare the sizes of the top 10 galaxies in the known universe. Take a look at exactly what we are going to create. This is what our JS treemap chart will look like by the end of the tutorial.

Lets start our interstellar journey!
Create a Basic JS Treemap Chart
Creating a JavaScript-based treemap chart generally takes four basic steps that are as follows:
- Create an HTML page
- Reference JavaScript files
- Set data
- Write some JS treemapping code
And dont worry if you are a novice in HTML, CSS, and JavaScript. We will go through each and every step in detail, and by the end of this tutorial, you will have your own JS treemap ready.
So, the countdown has begun, lets get our chart ready for launch.
1. Create an HTML Page
The first thing we do here is to create a basic HTML page. There, we add an HTML block element (<div>) thats where our treemap chart will be placed and assign it an ID attribute (for example, let it be container) to reference it later in the code.
We should also set some styling for the <div>. Lets define the width and height properties as 100% and margin and padding as 0. You may change this to your liking.
<!DOCTYPE html><html lang="en"> <head> <meta charset="utf-8"> <title>JavaScript Treemap Chart</title> <style type="text/css"> html, body, #container { width: 100%; height: 100%; margin: 0; padding: 0; } </style> </head> <body> <div id="container"></div> </body></html>2. Reference JavaScript Files
Next, we need to reference all the required scripts that will be used to create a treemap chart.
There are multiple JavaScript charting libraries out there to choose from. The fundamental steps of creating interactive data visualizations remain more or less the same with any of them. Here, for illustration, I am going to use AnyChart it supports treemaps and has a free version, with the source open on GitHub.
So, to build a treemap chart, we need the core and treemap modules. Lets reference both in the head section of the HTML page created in the first step. We will obtain them from the CDN (alternatively, the scripts can be downloaded).
<!DOCTYPE html><html lang="en"> <head> <meta charset="utf-8"> <title>JavaScript Treemap Chart</title> <script src="https://cdn.anychart.com/releases/8.11.0/js/anychart-core.min.js"></script> <script src="https://cdn.anychart.com/releases/8.11.0/js/anychart-treemap.min.js"></script> <style type="text/css"> html, body, #container { width: 100%; height: 100%; margin: 0; padding: 0; } </style> </head> <body> <div id="container"></div> </body></html>3. Set Data
Here comes the data. We will visualize the scale of the top 10 largest galaxies in the known universe. The galaxies are so incredibly vast that theyre measured by how many light-years across they are. A light-year is the distance a beam of light travels in a single Earth year, which equates to approximately 6 trillion miles.
I have already taken the galaxy scale data from Largest.org.
For our chart, the tree structure data will look as follows. The root-level element is Galaxies, divided (by galaxy type) into Elliptical and Spiral as its children, which further have arrays of individual galaxy objects as their own children.
Each galaxy object is provided with key-value properties of name and scale in light-years. For example, {name: "IC 1101", value: 4000000} means the IC 1101 galaxy with its scale being 4,000,000 light-years. Honestly, its very hard to comprehend how massive it is.
var dataSet = [ {name: "Galaxies", children: [ {name: "Elliptical", children: [ {name: "IC 1101", value: 4000000}, {name: "Hercules A", value: 1500000}, {name: "A2261-BCG", value: 1000000}, {name: "ESO 306-17", value: 1000000}, {name: "ESO 444-46", value: 402200}, ]}, {name: "Spiral", children: [ {name: "Rubin's Galaxy", value: 832000}, {name: "Comet Galaxy", value: 600000}, {name: "Condor Galaxy", value: 522000}, {name: "Tadpole Galaxy", value: 280000}, {name: "Andromeda Galaxy", value: 220000} ]} ]}];4. Write Some JS Treemapping Code
Now, just a few lines of JavaScript code to fuel up our treemap chart.
First, we include the anychart.onDocumentReady() function, which will enclose all the JavaScript code of the treemap ensuring it will execute when the web page is fully loaded and ready.
<script> anychart.onDocumentReady(function () { // The JS treemapping code will be written here. });</script>Second, we add the data we want to visualize in a treemap chart, from step 3.
<script> anychart.onDocumentReady(function () { var dataSet = [ {name: "Galaxies", children: [ {name: "Elliptical", children: [ {name: "IC 1101", value: 4000000}, {name: "Hercules A", value: 1500000}, {name: "A2261-BCG", value: 1000000}, {name: "ESO 306-17", value: 1000000}, {name: "ESO 444-46", value: 402200}, ]}, {name: "Spiral", children: [ {name: "Rubin's Galaxy", value: 832000}, {name: "Comet Galaxy", value: 600000}, {name: "Condor Galaxy", value: 522000}, {name: "Tadpole Galaxy", value: 280000}, {name: "Andromeda Galaxy", value: 220000} ]} ]} ]; });</script>Third, we add the following line to create a treemap from the tree data.
var chart = anychart.treeMap(dataSet, "as-tree");Finally, we add a title, put the chart in the previously defined <div> container, and display it using the draw command.
chart.title("The 10 Largest Galaxies in the Known Universe");chart.container("container");chart.draw();Now our JS treemap is basically ready, and if we stopped at that, it would look something like this:
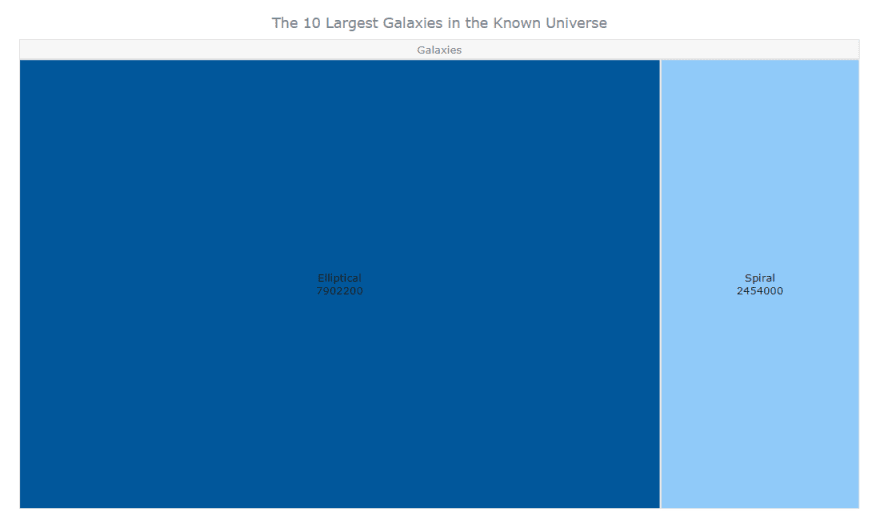
There are only two tiles visible immediately as the treemap chart is loaded, Elliptical and Spiral. We can click on those, and they will expand to show their respective children galaxies thats what is called a drill-down action.

Why is this happening, just two tiles? Because by default, the maximum depth value is set as 1. It means we can see only one level with its parent at a time. The lower levels are hidden. On the first level, we have Galaxies being divided into Elliptical and Spiral, so we only see that by default.
Now, what do we do to display all the galaxy tiles at once? Its very simple. We just need to change the maximum depth value using the maxDepth() function.
chart.maxDepth(2);The countdown is over, and our treemap chart is already now!

In this chart, we can see how the galaxies are grouped based on hierarchy, and we can also click on the Elliptical or Spiral headers at the top to zoom in on their childrens galaxies.
Look at the interactive version of this basic JavaScript treemap chart on JSFiddle or AnyChart Playground. Feel free to play around with it. You can also check out the full code below.
<!DOCTYPE html><html lang="en"> <head> <meta charset="utf-8"> <title>JavaScript Treemap Chart</title> <script data-fr-src="https://cdn.anychart.com/releases/8.11.0/js/anychart-core.min.js"></script> <script data-fr-src="https://cdn.anychart.com/releases/8.11.0/js/anychart-treemap.min.js"></script> <style type="text/css"> html, body, #container { width: 100%; height: 100%; margin: 0; padding: 0; } </style> </head> <body> <div id="container"></div> <script> anychart.onDocumentReady(function () { // create the data var dataSet = [ {name: "Galaxies", children: [ {name: "Elliptical", children: [ {name: "IC 1101", value: 4000000}, {name: "Hercules A", value: 1500000}, {name: "A2261-BCG", value: 1000000}, {name: "ESO 306-17", value: 1000000}, {name: "ESO 444-46", value: 402200}, ]}, {name: "Spiral", children: [ {name: "Rubin's Galaxy", value: 832000}, {name: "Comet Galaxy", value: 600000}, {name: "Condor Galaxy", value: 522000}, {name: "Tadpole Galaxy", value: 280000}, {name: "Andromeda Galaxy", value: 220000} ]} ]} ]; // create the treemap chart and set the data var chart = anychart.treeMap(dataSet, "as-tree"); // set the chart title chart.title("The 10 Largest Galaxies in the Known Universe"); // set the container id for the chart chart.container("container"); // initiate drawing the chart chart.draw(); }); </script> </body></html>It was quite effortless to create a beautiful JavaScript treemap chart, wasnt it? Now, you can see at a glance how the scale of the 10 largest galaxies looks and compare them.
The resulting chart already looks very good to me. But, let me show you how you can customize JavaScript treemaps whenever you want more.
Customize the JS Treemap Chart
Now, lets add some aesthetic and functional changes to make our interactive treemap chart even better and more insightful.
A. Change Colors
B. Apply a Linear Color Scale
C. Format Labels and Tooltips
D. Sort Tiles in Ascending Order
FOR A WALKTHROUGH OF THESE JS SURFACE CHART CUSTOMIZATIONS, CONTINUE READING HERE.
Original Link: https://dev.to/andreykh1985/how-to-make-a-treemap-in-javascript-5bn6
Dev To
More About this Source Visit Dev To