
An Interest In:
Web News this Week
- April 25, 2024
- April 24, 2024
- April 23, 2024
- April 22, 2024
- April 21, 2024
- April 20, 2024
- April 19, 2024
Some of Our Sources
- Engadget
- Mashable
- Simplebits
- Web Designer Wall
- Fuel Your Creativity
- Inspiredology
- Naldz Graphics
- Wal You
- Android Dissected
- Hashedout
Help Webnuz
Referal links:
Visualizing the Color Spaces of Images with Python and MatPlotLib
They say a picture is worth a thousand words, but that also means that storing an image takes up considerably more storage than a word. As such, a great deal of research has been made to understand the composition of images and how these compositions can be represented efficiently. In this project, we will not be talking about image compression, but we will be breaking down the composition of images in a visually appealing way.

Specifically, we are going to be using Python to break down the colors that are present in an image and we are going to be visualizing this color space using MatPlotLib.
First, lets talk about how we can represent a color in a 3D space. Software tends to break down colors into an RGB value: The mixture of Red, Green, and Blue values that compose the color. If youd like to get a sense of how different colors are broken down this way, check out this link:
https://www.rapidtables.com/web/color/RGB_Color.html
Now, these red, green, and blue values typically range from 0 to 255. Since each color is therefore represented by 3 values ranging from 0 to 255, we can plot any color on a 3D space fairly easily. For example, here are a few of the basic colors plotted on a 3D space.

In our example, the red value of a color determines its x coordinate, green determines its y coordinate, and blue determines its z coordinate. As you can see, when x and z are both 255 then we get violet, and when all 3 color parameters are 0 we get solid black. We can represent any color in the RGB color model through x, y, and z coordinates.
Alright, now let's start actually working with python. First, we are going to install our necessary libraries. Run the following command to install MatPlotLib, the library we will be using to plot our colors.
python -m pip install -U matplotlib
Next, we need to install Pillow, a Python library that lets us decompose images
pip install Pillow
Now lets import everything we need at the top of our python file:
import matplotlib.pyplot as pltfrom mpl_toolkits import mplot3dfrom PIL import ImageNow lets load in the image you want to breakdown with Pillow.
im = Image.open("PUT YOUR IMAGE PATH HERE")
For this example, Im going to be using this nice photo:

Next, we are going to create a 2D array of all the pixels in the image
px = im.load()
im.load() returns us a 2D array storing each pixel. Each pixel object is an array of 3 integers representing the RGB values of that specific pixel. I recommend that you play around with this px value to best understand how it is storing the pixels.
Next, let's set up our 3D space. MatPlotLib makes this incredibly easy. First, we are going to create the axes of our graph which we will specify to be 3D.
ax = plt.axes(projection = '3d')
To plot our color points, MatPlotLib requires us to give it 4 arrays, representing the x,y,z coordinates of all our points, as well as the color for each of the points. Lets make these arrays, which will be empty for now.
x = []y = []z = []c = []Now lets populate these arrays. To do so, we are going to have to iterate through all our pixels, adding the corresponding values to our x,y,z, and color arrays.
for rw in range(0,im.height): for col in range(0, im.width): pix = px[col,row] x.append(pix[0]) y.append(pix[1]) z.append(pix[2]) c.append((pix[0] / 255, pix[1] / 255, pix[2] / 255))Note that MatPlotLib requires that we normalize the RGB values between 0 and 1 when providing colors, so we divide each RGB value by 255. Also, note that this code will often result in the arrays containing duplicates, which is going to make MatPlotLib do more work than necessary.
To stop this, we can add an if statement so that it only adds the color if it is not already in the array.
for row n range(0,im.height): for col in range(0, im.width): pix = px[col,row] newCol = (pix[0] / 255, pix[1] / 255, pix[2] / 255) if(not newCol in c): x.append(pix[0]) y.append(pix[1]) z.append(pix[2]) c.append(newCol)Finally, we just need to plot these points, which we can do with MatPlotLib:
ax.scatter(x,y,z, c = c)
plt.show()
Upon running this python script with the following image:

We get the following plot:
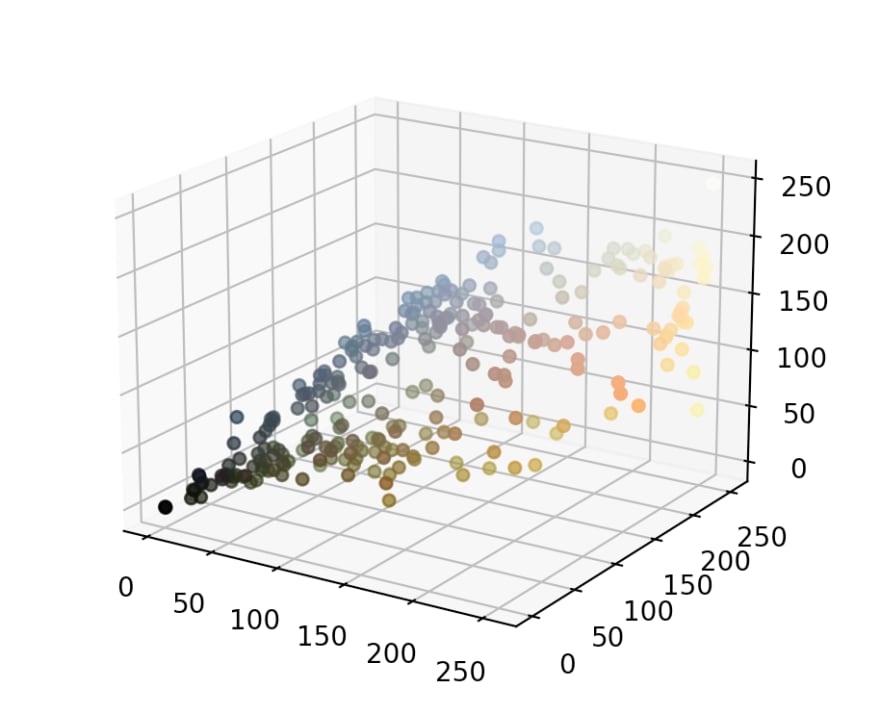
And there we go! Now for review, our final code is:
import matplotlib.pyplot as pltfrom mpl_toolkits import mplot3dfrom PIL import Imageim = Image.open("YOUR IMAGE PATH")px = im.load()ax = plt.axes(projection = '3d')x = []y = []z = []c = []for row in range(0,im.height): for col in range(0, im.width): pix = px[col,row] newCol = (pix[0] / 255, pix[1] / 255, pix[2] / 255) if(not NewCol in c): x.append(pix[0]) y.append(pix[1]) z.append(pix[2]) c.append(newCol)ax.scatter(x,y,z, c = c)plt.show()Hope you enjoyed this project! I recommend playing around with different images and seeing what patterns emerge among these color plots.
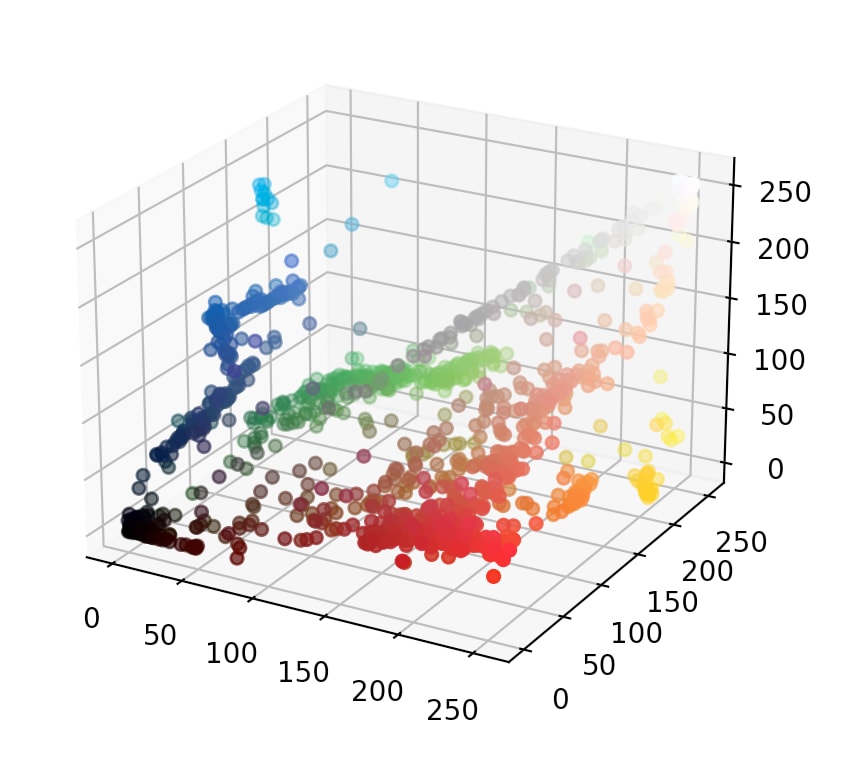
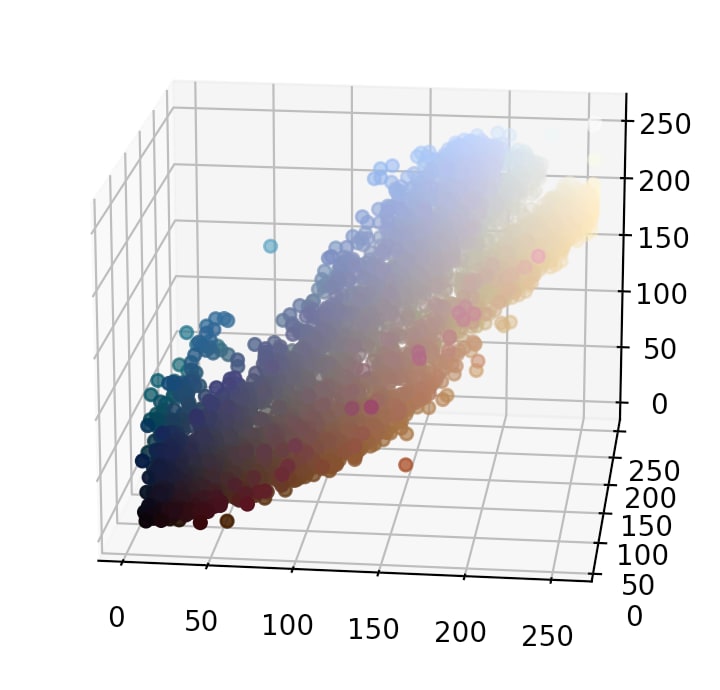
Here are some other plots that I made from different images:

Happy coding from your friends at Codesphere the all-in-one development platform!
Original Link: https://dev.to/codesphere/visualizing-the-color-spaces-of-images-with-python-and-matplotlib-1nmk
Dev To
More About this Source Visit Dev To