
An Interest In:
Web News this Week
- April 25, 2024
- April 24, 2024
- April 23, 2024
- April 22, 2024
- April 21, 2024
- April 20, 2024
- April 19, 2024
Some of Our Sources
- Joshua Blankenship
- TutsPlus - Design
- Vandelay Design
- You The Designer
- Naldz Graphics
- Specky Boy
- CSS Tricks
- Daily Now
- Dev To
- TechPowerUp
Help Webnuz
Referal links:
Hindi TV Serials: A Data Analysis
 |
|---|
| Credit: ZeeMELT and Kyoorius |
Introduction
TV Serials and family dramas have a special place in every Indians heart. Nothing can ever replace the iconic Dhum Ta Terenana score that amplifies the tension in the air or the Saas Bahu dramatic tropes introduced into the Indian Entertainment Industry by these TV Serials.
From classics like Saas Bhi Kabhi Bahu Thi and Sasural Simar Ka to modern entries like Shark Tank, this industry and this culture is ever-evolving and uniquely creative.
Its only fitting then, that when I found a dataset about Hindi TV Serials, I immediately decided to do this analysis and draw some interesting insights from it.
The Dataset
Let us start with looking at the dataset I am going to be using for this analysis project. This dataset titled Hindi TV Serials contains almost 800 unique values with the name of the serial, its cast, its IMDB rating and an overview.
It contains all the TV Serials aired on the following channels from 1988 to the present day (May 2022):
- Sab TV
- Sony TV
- Colors TV
- StarPlus
- Zee TV
Technically the dataset is distributed as a CSV file (181.76kB) and has 736 unique values spread of the following columns:
- Name
- Ratings
- genres
- overview
- Year
- Cast
Example Values from the Dataset
| Name | Ratings | genres | overview | Year | Cast |
|---|---|---|---|---|---|
| Kyunki Saas Bhi Kabhi Bahu Thi | 1.6 | "Comedy, Drama, Family" | A mother-in-law's struggle to put up with her three bahu's. The three bahu's have grown up sons. The bahu's sons start to get involved with having girlfriends and the bahu's try and break their relationships up. | 20002008 | "Smriti Malhotra-Irani ,Ronit Roy ,Amar Upadhyay ,Sudha Shivpuri" |
| Kahaani Ghar Ghar Kii | 2.1 | Drama | "The show explored the worlds of its protagonists Parvati Aggarwal and Om Aggarwal, who live in a joint family where by Parvati is an ideal daughter-in-law of Aggarwal family and Om the ideal son." | 20002008 | "Sakshi Tanwar ,Kiran Karmarkar ,Mita Vashisht ,Ali Asgar" |
I will be analyzing the relationships and the insights that each of the column provides when properly cleaned and arranged.
Setting up the Environment
I start with importing the necessary modules for this project:
- pandas
- numpy
- matplotlib
Then the dataset is imported into the environment through the read.csv method.
import pandas as pdimport numpy as npimport matplotlib.pyplot as pltdfmain = pd.read_csv("Hindi TV Serials.csv")The IMDB ratings
The IMDB ratings are going to be very important throughout this analysis as a way to judge the quality and popularity of a TV Show whenever applicable.
But before we dive-in into how other parameters relate and affect the IMDB rating of a show, let us independently look at these ratings.
Top 5 shows by IMDB ratings
We use the sort_values() function to get an output of the top shows according their IMDB ratings.
print(dfmain.sort_values(["Ratings"], ascending=False))Output:
Name Ratings ... Year Cast407 Mitegi Laxman Rekha 9.7 ... 2018 Aayesha Vindhara ,Ankita Goraya ,Rajeev Saxena...242 Shobha Somnath Ki 9.4 ... 20112012 Ashnoor Kaur ,Tarun Khanna ,Joy Rattan Singh M...79 Love U Zindagi 9.4 ... 2011 NaN586 Wagle Ki Duniya 9.2 ... 2021 Sumeet Raghavan ,Pariva Pranati ,Sheehan Kapah...742 Jagannath Aur Purvi Ki Dosti Anokhi 9.2 ... 2022 Rajendra Gupta ,Sushmita Mukherjee ,Ismeet Koh..... ... ... ... ... ...(remaining output omitted due to irrelevancy)As is clearly discernible, the top 5 shows according to their ratings are:
- Mitegi Laxman Rekha (9.7)
- Shobha Somnath Ki (9.4)
- Love U Zindagi (9.4)
- Wagle Ki Duniya (9.2)
- Jagannath Aur Purvi ki Dosti Anokhi (9.2)
Well I am not sure I agree with these results but well if you say so IMDB, if you say so...
The Cast and The Artists
Analyzing the cast column can provide some interesting statistics to look at, but there is a serious problem that limits us from using it to any useful extent.
The problem is the format in which these values are stored in the dataset.
For example take the value for the "Cast" column in the row for Shobha Somnath Ki:
|Cast|
|---|
|Ashnoor Kaur ,Tarun Khanna ,Joy Rattan Singh Mathur ,Sandeep Arora|
This value is troublesome as it is stored as a single <str> type object and thus it is not possible to calculate or discern any data for individual cast members.
Cleaning Data: Solving the Cast Problem
Thankfully, as elaborated by Max Hilsdorf in his Medium blog, the string object present in the cell can be converted into a list object, and subsequently into a one dimensional data type that can allow functions like value_counts() and groupby() to function.
But his solution does not apply to our problem without extensive modifications as the values we wish to convert to a list do not have any pre-existent list based syntax. Therefore we need to convert each cell in the Cast Column into a value based on list syntax i.e. ["a","b","c",...].
We can implement this by writing a function the takes input in the format that we have and then adding the square brackets and the quotation marks and returning it in the format that we need. This is my implementation of such a function:
def clean_artist_list(list_): if type(list_) is str: list_ = "[" + list_ + "]" list_ = list_.replace(',', '","') list_ = list_.replace('[', '["') list_ = list_.replace(']', '"]') list_ = list_.replace(' "', '"') return list_ else: return "[]"This function also takes care to properly handle and replace any disruptive data. I mainly encountered some FLOAT datatypes which threw errors as they could not be treated like strings.
After applying this function and the python eval() function, we have the required list datatypes.
dfmain["Cast"] = dfmain["Cast"].apply(clean_artist_list)dfmain["Cast"] = dfmain["Cast"].apply(eval)Before proceeding we also need to create the function needed to convert these 2D lists to 1D. For that we will use:
def to_1D(series): return pd.Series([x for _list in series for x in _list])Top Rated Artist
Now that we can use the Cast data properly, lets find out which artist has the best average IMDB ratings for the shows they worked in.
df_cast_imdb = dfmain.groupby(to_1D(dfmain["Cast"])).mean()print(df_cast_imdb.sort_values(["Ratings"],ascending=False))Output:
RatingsTusharr Khanna 9.2Sahil Mehta 9.2Vrajesh Hirjee 9.2Gautami Kapoor 9.1Vaidehi Amrute 9.1... ...(remaining output omitted due to irrelevancy)The artists with the best mean IMDB rating for his shows is Tushar Khanna. He has worked in "Pyaar Tune Kia Kya", "Piyaa Albela" and "Bekaboo".
This however does not necessarily reflect any superiority in acting or talent, but it may show (at least to people who believe in it) some signs of luck an artist brings to a set.
Most Experienced Artist
Now moving to a more concrete relation. We will be finding out which actor has worked in the most TV shows.
It should be noted that the values of this dataset only list the leading cast members in the cast section and thus artist with minor roles are not properly recognized in this analysis.
print(to_1D(dfmain["Cast"]).value_counts())Output:
Ronit Roy 9Jennifer Winget 8Seema Kapoor 7Sangeeta Ghosh 7Shahab Khan 7 ..(remaining output omitted due to irrelevancy)Ronit Roy having worked in 9 shows, comes out to be the most experienced artist in this dataset. No wonder I see him in every other serious father type role.
Genre
Its either comedy (the family kind) or drama (also the family kind) with Indian TV Serials. But don't take my word for it, let us see for ourselves the genre dynamics of Indian TV.
Cleaning Data: Genre
Genres also face the same problem as we faced above with artists. There is a small edit made to handle redundancies due to whitespace characters.
def clean_genre_list(list_): if type(list_) is str: list_ = "[" + list_ + "]" list_ = list_.replace(',', '","') list_ = list_.replace('[', '["') list_ = list_.replace(']', '"]') list_ = list_.replace(' "', '"') list_ = list_.replace(" ","") return list_ else: return "[]"It is then used similarly as the Cast solution.
dfmain["genres"] = dfmain["genres"].apply(clean_genre_list)dfmain["genres"] = dfmain["genres"].apply(eval)Most Acclaimed Genre
First lets look at which genre claims the best mean IMDB ratings and garners the best critic response.
df_genre_imdb = dfmain.groupby(to_1D(dfmain["genres"])).mean()print(df_genre_imdb.sort_values(["Ratings"],ascending=False))Output:
RatingsWar 6.900000Horror 6.684211Adventure 6.680000Biography 6.650000Sport 6.500000Family 6.443478Crime 6.271429History 6.162500Action 5.966667Comedy 5.961644(remaining output omitted due to irrelevancy)Humans do love war, huh.
Bigger Genre
Next lets look at which genre the creators love the most and thus create the most shows based around.
df_genre_count = to_1D(dfmain["genres"]).value_counts()print(df_genre_count)df_genre_count.plot(kind = 'bar')plt.show()Instead of the text output, a visual representation of the output would be more suitable here, thus we generate a bar graph using the Series.plot() function.
Output:

So THAT is why Indian households end up being so dramatic...
Release Year
Shows like "Sarabhai vs Sarabhai" were definitely much ahead of their time. But lets look at how time affected the rest of the Indian TV.
Cleaning Data: Years
To make use of the data in the Years column, we need to convert it into forms that are not haphazard and unusable like it originally is.
I created two new columns based on the Years column:
- First Year: This column tracks the year in which the show started airing.
- Years Run: This column tracks how long a show ran.
These columns were created with the following code:
def findstart(list_): if type(list_) is str: list_ = list_[:4] return list_ else: return ""def duration(list_): if type(list_) is str: if len(list_) == 9 and list_[0]!="I": l1 = int(list_[:4]) l2 = int(list_[5:]) return l2-l1 else: return 0 else: return 0dfmain["First Year"] = dfmain["Year"].apply(findstart)dfmain["Years Run"] = dfmain["Year"].apply(duration)The code was made to handle edge cases like wrong datatype and the weird "I XX" values in the Year column.
Busiest Year
Which year was the busiest for the creators? We can use the following code to visualize the frequency of productions across years.
df_year_count = dfmain["First Year"].value_counts().sort_index()df_year_count = df_year_count.iloc[:-4] #removing the weird I valuesdf_year_count.plot(kind = 'bar')plt.show()Output:
2017 brought us shows like "Naagin 2", "Yeh Rishta Kya Kehlata Hai" and "Yeh Hein Mohabbatein". In total it records the production of 59 shows compared to the runner up 2018 with 46 shows.
Longest Running Show
Indian shows like "Sasural Simar Ka" and "Kyunki Saas Bhi Kabhi Bahu Thi" are infamous for running long enough to be part of a late teenager's life since birth. So its obvious to find out which show actually has the longest runtime.
print(dfmain.sort_values(["Years Run"], ascending=False))Output:
Name Ratings ... First Year Years Run720 C.I.D. 6.8 ... 1998 20255 Hum Paanch 8.2 ... 1995 11536 Yes Boss 8.4 ... 1999 100 Kyunki Saas Bhi Kabhi Bahu Thi 1.6 ... 2000 81 Kahaani Ghar Ghar Kii 2.1 ... 2000 8.. ... ... ... ... ...(remaining output omitted due to irrelevancy)"C.I.D." is no-doubt part of every Indian's life. With iconic characters like ACP Pradyuman, Abhijit, and Daya, and a premise revolving around crime in India, its not a surprise that it had a runtime of 20 years.
Analyzing the Overviews
Here comes the part I was most excited for. The written descriptions and overviews of these shows could surely provide me some very interesting insights that could have been the highlights of this project.
Unfortunately after cleaning the data and writing the code to analyze it, it was shocking to see how useless the ordeal was. The data did was not sufficient and quality enough to let me draw any real conclusions from it.
But I will still show the method I used to clean and try analyzing the data.
Cleaning Data: Description
Similar to the approach I took for the problems with other columns, I decided to convert the string based values to a list with every word being an element of the list. Also additionally the words were all turned to lowercase and any special characters were removed so as to make sure that redundancy was minimized.
def clean_ovw_list(list_): if type(list_) is str: list_ = "[" + list_ + "]" #removing all the special characters list_ = list_.replace(',', '') list_ = list_.replace('.', '') list_ = list_.replace('"', '') list_ = list_.replace('(', '') list_ = list_.replace(')', '') list_ = list_.replace('-', '') list_ = list_.replace('', '') list_ = list_.replace(' ', '","') list_ = list_.replace('[', '["') list_ = list_.replace(']', '"]') list_ = list_.replace(' "', '"') #converting to lower case list_ = list_.lower() return list_ else: return "[]"The function was applied:
dfmain["overview"] = dfmain["overview"].apply(clean_ovw_list)dfmain["overview"] = dfmain["overview"].apply(eval)Now we have data that we can supposedly work on.
Usage of words over time
I planned to analyze multiple words like "love", "hate", "mother", "mother-in-law", "brother", etc. and their usage over time in the descriptions of TV Serials and even plot graphs showing interesting relations between the trends of different words.
This code gives the count of the words used grouped by years:
df_ovwcount = dfmain.groupby(['First Year',to_1D(dfmain["overview"])]).count().reset_index()The following code could be used to plot the variance of occurance of words overtime, and also to show contrast in different words.
#Selecting and plotting the first worddf_selectedword = df_ovwcount[df_ovwcount["level_1"].isin(["First Word"])]plt.plot(df_selectedword["First Year"],df_selectedword["overview"])#Selecting and plotting the second worddf_selectedword = df_ovwcount[df_ovwcount["level_1"].isin(["Second Word"])]plt.plot(df_selectedword["First Year"],df_selectedword["overview"])plt.xticks(rotation=90)plt.show()A visualization generated through this code (provided better data) could have looked like this:
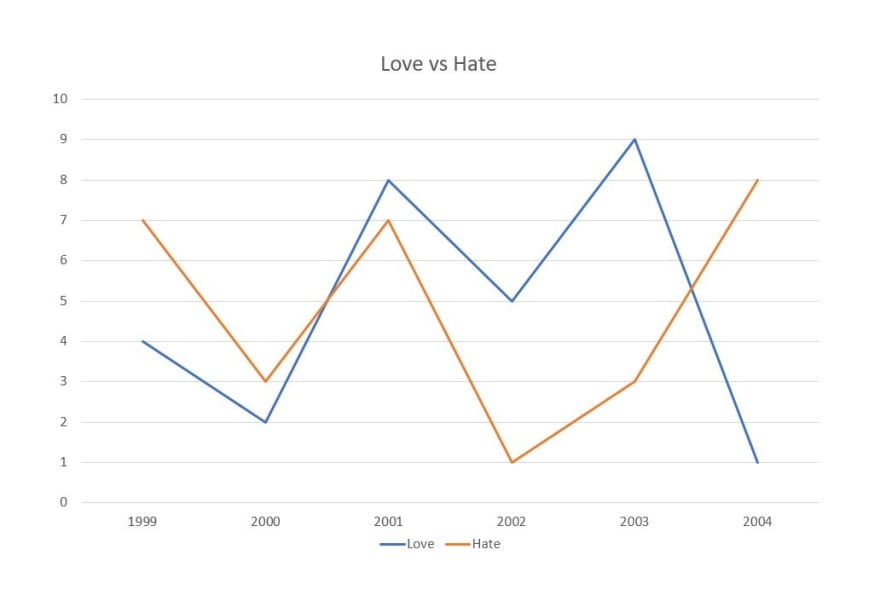
This data could have led to a lot of other interesting analysis too, but unfortunately it was not possible.
Most Used Word
We can still draw some simple insights from this data. Let us find out the 50 most used words in the descriptions for Indian TV Serials.
df_ovw_count_simple = to_1D(dfmain["overview"]).value_counts()print(df_ovw_count_simple.head(50))Output:
1843a 856the 848and 647of 588to 394is 338her 314in 302who 201with 191story 185their 158his 140on 129family 128love 125an 125plot 119add 118see 117full 117summary 114for 113from 111life 107she 105by 103girl 84as 79that 79two 76are 73show 72they 71but 71when 66young 57about 57around 56this 53lives 52it 51has 49he 49married 47series 47one 44other 42revolves 41Some significant meaningful words come out to be "family", "love" and "life"... That is some Fast & Furious philosophy it seems.
Conclusion
Indian TV is definitely an interesting place to observe and analyze. This project aimed at looking at some of the angles of the vast possibilities that are present with proper datasets.
But the tip of the iceberg that we touched also gave us some interesting results:
- Top 5 Indian TV Shows by IMDB Rating.
- Artists with the best mean IMDB Rating.
- Artists with the most experience.
- Genre with the best mean IMDB Rating.
- Genre with the most available content.
- The release frequency of shows over the years.
- The longest running shows.
- Usage of certain words in the overviews of TV shows over time.
- Most used words in TV Show descriptions.
This project also helped me cement my skills in data analysis, especially learning how to analyze a varied dataset in multi-faceted fashion.
I also gained experience cleaning data and how to treat list like values in cells and treat elements individually.
Thankyou to everyone who actually stuck with reading till here, it was very fun for me to work on this project.
Original Link: https://dev.to/subh_2111/hindi-tv-serials-a-data-analysis-al3
Dev To
More About this Source Visit Dev To