
An Interest In:
Web News this Week
- April 2, 2024
- April 1, 2024
- March 31, 2024
- March 30, 2024
- March 29, 2024
- March 28, 2024
- March 27, 2024
Some of Our Sources
- Techcrunch
- Technology Review
- Team Treehouse
- Just Creative
- Joshua Blankenship
- Inspiredology
- FanExtra - PSD
- Noupe
- Web Design Ledger
- The Verge
Help Webnuz
Referal links:
Web Performance - Renderland's Saga, Book 1
Where Everything Began - First Act
"Knowledge is like money: to be of value it must circulate, and in circulating it can increase in quantity and, hopefully, in value." ~ Louis L'Amour
In February, I had a task to improve the performance of an NFT marketplace. I had surface knowledge of web performance at the time. I spent an insane amount of time researching and watching tech talks on videos. I decided to write this article to make the journey easier for you.
The Portal
Aimlessly looking for answers with a gazillion tabs open, my PC freezes with no solution in sight. I decide to shut down my PC and then go out for a walk to clear my thoughts.
I return 30 minutes later to find a strange blue light emitting from my room. It was coming from my PC which was still on but frozen. I try long pressing the power button but I end up getting sucked into the screen.
The Giant Robot
I wake up in a weird-looking room then I immediately get approached by a giant robot with the letters HTML on its chest.
Robot: Hi, I'm HTML5. I'm glad you woke up, welcome to Renderland!
Me: Where am I?
Robot: You're in Renderland.
Me: Render what???
What is Renderland?
Renderland is the planet on which Rendering takes place. It's the closest planet to the screen and it's what users see and interact with. It's located in the Browser's Solar System which is also under the The Web Galaxy.
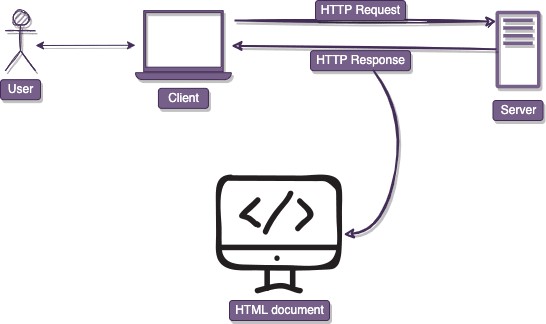
This diagram shows how a typical request travels through the internet where it finally reaches a server which sends back a response to the client.
The response manifests different entities such as Styles, Markup, Scripts, Fonts, and other files. They represent the different life forms on Renderland. They live together to make up the content that you see and interact with.
The Citizens of Renderland
HTML, the planet's elder summoned us all for a meeting under the Sacred Tree.
Robot 1 I'm HTML, you've probably met my grandson, HTLM5. We're both from the Markup tribe and we make up the content of pages on the web.
Robot 2 I'm CSS from the Styles tribe, and we give web pages looks and style.
Robot 3 I'm JavaScript but you can call me JS, I'm from the Scripts tribe- no relation, and we practice making web pages interactive.
HTML A prophecy spoke of a FullSnack Engineer with a mechanical keyboard and an E mark who'd save Renderland. The Engineer spoke an ancient language called Code.
JS We believe you're the chosen one.
Renderland's History
Long ago, the robots lived in a faraway land known as ServerLand where they served a group of entities called clients. The clients lived in ClientLand and they all had different shapes and sizes.
A Serverland native is referred to as server and a Clientland native is referred to as client.
The request-response-cycle is a model that describes how clients and servers communicate over a network via a protocol such as HTTP or Web Sockets.
Rendering
Rendering is the process of turning a web page's assets (HTML, CSS, JSS, and other static assets) into interactive content on the browser. Rendering steps include style, layout, paint, and, in some cases, compositing.
Critical Rendering Path (CRP)
The Critical Rendering Path is the sequence of steps the browser goes through to convert the HTML, CSS, and JavaScript into actually visible pixels on the screen.
The Render Tree
HTML5 and CSS then summoned me to the Sacred Tree. They began explaining the history of the tree and how it came to life.
Document Object Model (DOM) describes the structure browsers use to represent HTML elements internally.
CSS Object Model (CSSOM) describes the structure browsers use to represent CSS styles internally.
Both are represented internally as a tree-like structure that allows programs to interact with the CSS and HTML content of a web page.
The Render Tree is the product of combining DOM and CSSOM trees. It defines the structure of a web page. The tree contains only the visible elements of a web page.
The browser calculates the layout of each visible element and then paints it on the screen with the help of the Render Tree.

Layout (Reflow)
Browser computes the geometry of the layout and its elements based on the render tree.
Paint
Browser paints pixel by pixel to create the visual representation we see on the screen. Using the Render Tree, the browser engine calculates the position of each visible element of a web page.
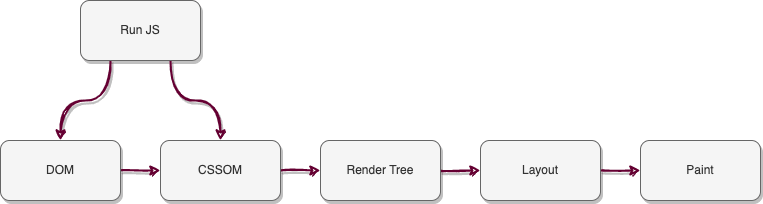
Rendering in Short
- Assets Converting the web page's HTML and CSS code into
DOMandCSSOM. - Render Tree Constructing the Render Tree by combining
DOMandCSSOM. - Layout Calculate the size and position of each
node. - Paint painting
elementson the browser's screen for users to view.
Rendering Patterns
The robots then began explaining how rendering is practiced in Renderland.
Server Side Rendering (SSR)
The most ancient form of Rendering. This pattern generates the full HTML for the page content to be rendered in response to a user request.
Client Side Rendering (CSR)
This form of rendering became popular during the Ajax era in 2005. Ajax which stands for Asynchronous JavaScript and XML allowed developers to build client-side applications.
In this pattern, the server renders a skeleton of an HTML container whilst the client handles the logic required to render a web page. The client takes care of fetching, templating, routing, etc.
Guardians of Renderland (The Pillars )
Also known as the Web's Vitals, they are Renderland's guardians of performance. They measure and report any issues that may affect the performance of a web page.
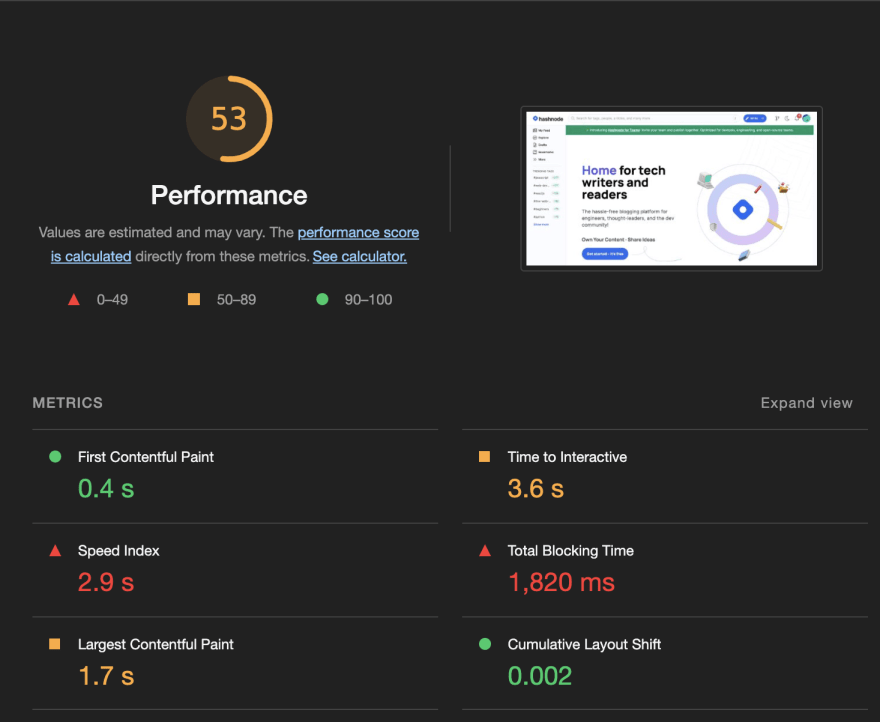
This screenshot is from Lighthouse's report on Hashnode's home page.
First Pillar (First Byte) 1
This Pillar is responsible for reporting the arrival of the very first byte of incoming data. It helps quantity a server's response time by measuring the latency of a round trip to and from said server. It precedes every other Pillar.
Time to First Byte (TTFB) The time between the initial request and the arrival of the first byte.
Second Pillar (Paint)
This Pillar measures the time a browser takes to paint pixels on a screen. The shorter the time, the better the performance.
First Paint (FP)
The first instance of content that appears on the browser. Think of it as the first drop of water when you open the tap.
First Contentful Paint (FCP)
Measures how long it takes the browser to render the first piece of DOM content after a user navigates to your page.
The recommended FCP score is 1.8 seconds or less
Largest Contentful Paint (LCP)
The time when the main page content becomes visible. It consists of the initial HTML document + LCP Resource.
The recommended LCP score is 2.5 seconds or less
Third Pillar (Time to Interactive)
Also known as (TTI), represents the state at which a web page is ready to respond to events and user interactions. This is made possible when all the Scripts tribe members have arrived/loaded.
TTI is reached only after FCP. Having a huge gap between these two metrics causes serious problems.
The recommended TTI score is 3.8 seconds or less
Total Blocking Time (TBT)
The total amount of time between FCP and TTI. It means that the event handlers are registered for most visible page elements, and the page responds to user interactions within 50 milliseconds.
The recommended TBT score is 200 milliseconds or less
Attack on Renderland - Second Act
"If you know the enemy and know yourself, you need not fear the result of a hundred battles. If you know yourself but not the enemy, for every victory gained you will also suffer a defeat. If you know neither the enemy nor yourself, you will succumb in every battle." - Sun Tzu, The Art of War.
We receive multiple reports from different locations. Web pages are unresponsive, some fail to load and others are painfully slow.
It was later revealed that Renderland is being invaded by an intelligent species of bugs. They came in different shapes and sizes and wreaked havoc on the planet.
Bugs vs Pillars
The bugs have directed their first attack on the pillars. Let's see how each metric affects performance.
First Pillar (First Byte) 1
The bugs that affect this network usually manifest in the form of network or device issues.
The following factors may affect TTFB
- The Network protocol, HTTP/1 instead of HTTP/2 for example.
- Longer network
request phases. You can learn more about this here.
Second Pillar (Paint)
This metric mainly reports performance issues related to static/viewable content. The bugs that affect this metric usually manifest in the form of unoptimized assets such as HTML, CSS, and images.
Third Pillar (Interactivity)
The bugs that affect this pillar mainly focus on scripts since it focuses on issues related to the interactivity/usability of a web page. Unoptimized JavaScript is the biggest offender in this category because it needs to be parsed and compiled before it's finally executed.
Miscellaneous Performance Bottlenecks
These are some of the most common web performance bottlenecks.
Blocking Resources
These include the scripts, styles, and HTML imports that block or delay the browser from rendering content to the screen.
Bundle Size
This is the amount of JavaScript a user will have to download to load your website. A larger bundle size means users will have to wait longer before they could interact with your site.
Network Requests
Enormous network payloads reduce the application's performance. Also, higher latencies make requests take longer to travel to and from the server.
DOM/CSSOM Bottlenecks
- Event handlers are costly.
- Layout thrashing and reflows cause re-renders meaning the browser will have to recalculate and re-paint content with every reflow.
The Resistance - Final Act
"With great power comes great responsibility."
As developers, we must make sure that the apps we build are performant and resilient. This section will equip you with new superpowers to assume this role.
Measuring Performance
To defeat the bugs, we need fully understand to how to measure the impact of their attacks on performance.
How is performance measured?
- Field Testing Involves real users loading and interacting with the page.
- Lab Testing Using tools to simulate a page load in a predictable environment.
Field Testing
Also known as Real user monitoring (RUM) refers to the process of recording user interactions on a production website.
Examples of RUM software: InfluxDB, Google Analytics, CloudFlare, Stackify, etc.
This topic is beyond the scope of this article so we'll jump right into Lab Testing.
Lab Testing
Refers to the process of testing an application in an environment such as development or staging before the site is released to the public.
Rescuing the Pillars
Learning how to measure the performance of a website was the first step. Now we need to learn how to optimize the metrics we measured.
First Pillar (First Byte) 1
This metric indicates how fast or slow a server is. It measures the latency of a round trip to and from a server.
Measuring TTFB
- Field Web Vitals Library or Chrome's User Experience Report.
- Lab The
Developer Toolspanel in web browsers or Web Page Test.
How to improve TTFB
- Better server infrastructure (Using Load Balancers and Caches) for example.
- Pre-connect to required origins for cross-origin resources.
- Using HTTP2 if possible.
Second Pillar (Paint)
Asset optimization can play a huge role in improving this performance metric. Let's see how we can accomplish this.
Measuring Paint Metrics
- Field Web Vitals Library or Chrome's User Experience Report.
- Lab The
Developer Toolspanel in web browsers or Web Page Test.
How to improveFCP
- Eliminate render-blocking resources.
- Minify CSS and remove unused JavaScript code.
- Reduce
TTFB. - Avoid enormous network loads and
pre-loadcrucial requests. - Serve static assets with an efficient cache policy.
How to improve LCP
- Reduce
TTFB. - Optimize resource load times, for example compressing images, serving them in different sizes, using a
CDN, etc. - Optimizing CSS, for example compressing, removing unused CSS and deferring non-critical CSS.
- Shortening the Critical Rendering Path (CRP).
- Deferring non-critical scripts and add scripts to the body of the HTML document.
Third Pillar (Time to Interactive)
You might be familiar with JavaScript's single thread nature, if not then this article might be a great resource for you.
What is a Main Thread?
The main thread is where a browser processes user events and paints. The browser uses a single thread to run a page's JavaScript, as well as the Critical Rendering Path. The browser may not respond to user interactions if the main thread is blocked/occupied by another process.
How to improve TTI
1. Minimizing Main thread's work
We run most of our code on the main thread. Lifting off the burden or delegating some of this work to another Service can increase the performance of a web page.
2. Debouncing Events
Delaying the execution of event handlers can increase performance because it helps the browser avoid fast consecutive events. These events can block frames from completing, and can cause additional and unnecessary layout work.
3. Web Workers
Web workers can be used to delegate complex processes and run tasks in the background in a separate thread.
4. Minification
Minifying and deferring non-critical CSS/JavaScript can increase a web page's performance.
5. Code Splitting
Means the browser will only download the JavaScript users need at the time. For example, let's consider a web app with three pages, namely home, chat and notifications. Code-splitting allows you to download only the JavaScript relevant to your home page and then download the remaining assets on-demand or when a user navigates to a page that actually needs.
6. Event Delegation
Propagating or bubbling up an event in the hierarchy of the DOM tree can increase a web page's performance.
Additional Rendering Patterns
We've previously discussed the two main rendering patterns, namely Client Side Rendering (CSR) and Server Side Rendering (SSR). Now it's time to introduce some new rendering patterns that combine the best of the two worlds.
SSR with Rehydration
This pattern uses a pre-built DOM with components rendered as HTML. The app then loads the remaining data in the client side.
CSR with Pre-rendering
This pattern renders an app shell to static HTML during build time .
Miscellaneous Performance Tips
- Detect and eliminate unnecessary re-renders. Why did you render is a great library if you're building an app using
React. - Memoize values with React.memo/callbacks.
- Analyze your packages if you're using
WebPack. WebPack Bundle Analyzer is a great choice. I've personally used it to improve the performance of an NFT marketplace.
Conclusion
Choosing the right tool for the job is a critical skill for every Software Engineer. Software choices are usually determined by the project's requirements.

Resources
- Web Performance Fundamentals by Todd Gardener.
- Chrome Developers Blog.
- Web Dev.
- Annie Sullivan | Lessons learned from performance monitoring in Chrome.
- Aero Twist's Blog.
- High Performance Networking.
- JavaScript Performance by Steve Kinney.
- The main thread is overworked & underpaid (Chrome Dev Summit 2019).
I'm currently working on a few more sagas. Let me know if you're interested in more sagas in the comments below
NB: Part 2 of this article. will explore the practical aspects of web rendering performance. I decided to break it into two parts because I don't want to overwhelm the reader.
Subscribe or follow to get notified!
Fun Fact: This article's story line was inspired by
- This Tweet
- Lupe Fiasco's The Cool.
- Demon Slayer: Kimetsu no Yaiba.
- Marvel Movies (Thor, Spiderman and Thor 2).
- Attack on Titan.
Original Link: https://dev.to/junubiman/web-performance-renderlands-saga-book-1-2mkp
Dev To
More About this Source Visit Dev To