
An Interest In:
Web News this Week
- March 22, 2024
- March 21, 2024
- March 20, 2024
- March 19, 2024
- March 18, 2024
- March 17, 2024
- March 16, 2024
Some of Our Sources
- Slashdot
- The Logo Smith
- Six Revisions
- FanExtra - PSD
- My Ink Blog
- Wal You
- Freelance Switch
- Web Resource Source
- Android Headlines
- TechPowerUp
Help Webnuz
Referal links:
How to Use a Javascript Reporting Tool with Ruby on Rails
ActiveReportsJS is a 100% client-side reporting tool with zero server dependencies. It means that you can use ActiveReportsJS together with any web server, including a Ruby on Rails application. This article contains a simple yet thorough tutorial on integrating ActiveReportsJS with a Ruby on Rails application. By the end, you will be able to do the following:
- Create a Ruby on Rails application serving a JSON API
- Create a data model for the JSON API
- Initialize the data from a CSV file
- Configure JSON API endpoints
- Create an ActiveReportsJS report to visualize the data from the JSON API
- Create a static HTML page to display the report in the report viewer
Prerequisites
The following content assumes that you have Ruby on Rails installed on your machine. If you don't have it, you can obtain it from theRuby on Rails website. It would be best if you also had ActiveReportsJS installed on your machine. If you don't have it, you can obtain it from theActiveReportsJS website.
Create a Ruby on Rails Application
To create a new Ruby on Rails application, run the following command from a terminal or command prompt.
rails new ReportingOnRails --apiThen open the newly createdReportingOnRailsdirectory in your favorite code editor, such as Visual Studio Code.
Create a Data Model for the JSON API
We will use the Sales dataset that you can download fromE for Excelwebsite. It offers datasets of various sizes, starting from 100 records to 5M records. For simplicity, we will use the first dataset, which has 100 records.
There are many fields in the dataset, but we will only use several of them in this tutorial. To create a data model for the JSON API, run the following commands from theReportingOnRailsdirectory.
rails g model Sale region:string country:string itemType:string unitsSold:float rake db:migrate# or the following for Windows: # bin\rails g model Sale region:string country:string itemType:string unitsSold:float # ruby bin\rake db:migrateInitialize the Data from a CSV File
Download and unzip the data from the100-Sales-Records.ziparchive into the lib\seeds directory of the application.
Install thecsvgem into the application.
Then open thedb/seeds.rbfile and replace its content with the following code.
require'csv'csv_text =File.read(Rails.root.join('lib','seeds','100 Sales Records.csv')) csv =CSV.parse(csv_text,:headers=>true,:encoding=>'ISO-8859-1') # puts csvcsv.eachdo|row| #puts row.to_hash Sale.create!(region: row['Region'], country: row['Country'], itemType: row['Item Type'], unitsSold: row['Units Sold']) endFinally, run the following command from the terminal or command prompt.
rake db:seed # or ruby bin\rake db:seed in WindowsConfigure JSON API Endpoints
Open theconfig/routes.rbfile and replace its content with the following code:
Rails.application.routes.drawdo get'api/sales', to:'application#sales' endNow openapp/controllers/application_controller.rband paste the following code snippet:
classApplicationController < ActionController::API defsales @sales= Sale.all render json:@sales end endThen run the application by using the following command:
rails server # or ruby bin\rails server for WindowsAnd open the browser tohttp://localhost:3000/api/salesto see the data the JSON API returns.
Create an ActiveReportsJS Report
Let's now create a report that visualizes the data from the JSON API.
In theStandalone Report Designer Application, click theFilemenu and select theContinuous Page Layouttemplate for a newly created report.
Open theData panelof the property inspector and click theAddbutton.
In the Data Source editor dialog, typehttp://localhost:3000/api/salesin theENDPOINTfield and click theSave Changesbutton.

Click the+icon nearDataSourcein the Data panel.
In theData Set Editordialog, typeSalesin the NAME field and $.* in theJSON Pathfield.
Click theValidatebutton, ensure that theDataBase Fieldssection displays[7 items]text, and click theSave Changesbutton.

Expand thetoolboxusing theHamburgermenu located on the toolbars left side.
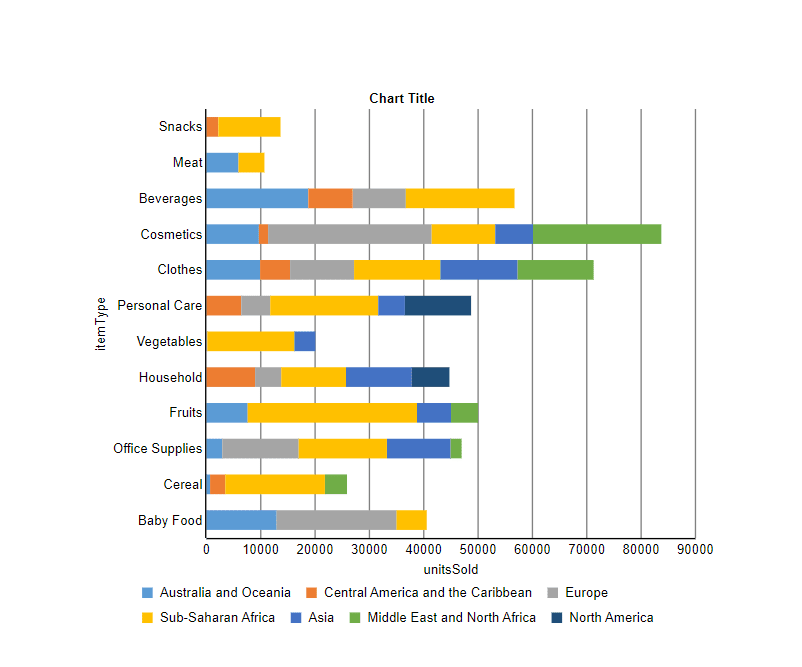
Drag and drop theChartitem from the toolbox to the report page area's top-left corner. TheChart Wizarddialog appears. Select theBartype and click theNextbutton on the first screen.
On the second screen of the dialog, configure the data as shown in the following image and click theNextbutton.

On the third screen, click theFinishbutton.
Resize the chart report item to fill the entire width of the report page. Click the chart legend to load its properties into the properties panel, and set theOrientationproperty toHorizontalandPositionproperty toBottom.
Click theFilemenu and save the newly created report in thepublicfolder of the application under the nameSalesReport.rdlx-json.
Create a Static HTML Page to Display the Report
In theapplication's public folder, create anindex.htmlfile and replace its content with the following code.
<!DOCTYPE html> <htmllang="en"> <head> <metacharset="UTF-8"> <metahttp-equiv="X-UA-Compatible"content="IE=edge"> <metaname="viewport"content="width=device-width, initial-scale=1.0"> <title>Sales Report</title> <link rel="stylesheet" href="https://cdn.grapecity.com/activereportsjs/3.latest/styles/ar-js-ui.css" type="text/css" /> <link rel="stylesheet" href="https://cdn.grapecity.com/activereportsjs/3.latest/styles/ar-js-viewer.css" type="text/css" /> <scriptsrc="https://cdn.grapecity.com/activereportsjs/3.latest/styles/ar-js-ui.css"></script> <scriptsrc="https://cdn.grapecity.com/activereportsjs/3.latest/dist/ar-js-viewer.js"></script> <scriptsrc="https://cdn.grapecity.com/activereportsjs/3.latest/dist/ar-js-pdf.js"></script> <style> #viewer-host { width: 100%; height: 100vh; } </style> </head><body> <divid="viewer-host"></div> <script> var viewer = new ActiveReports.Viewer("#viewer-host"); viewer.open('/SalesReport.rdlx-json'); </script> </body> </html>Make sure that the application runs and visit the browser tohttp://localhost:3000/index.htmlto see the report. If you followed the steps correctly, you should see a report that displays the data from the JSON API.
Original Link: https://dev.to/chelseadevereaux/how-to-use-a-javascript-reporting-tool-with-ruby-on-rails-5fae
Dev To
More About this Source Visit Dev To