
Some of Our Sources
- Just Creative
- Pearsonified
- Six Revisions
- TutsPlus - Design
- Creative Curio
- Inspiredology
- Fudge Graphics
- Web Design Ledger
- Reencoded
- Line 25
Help Webnuz
Referal links:
Get Started with OpenTelemetry Python: A Practical Guide
This is a practical guide that gives you just what you need to get started with OpenTelemetry in Python without any prior knowledge in OpenTelemetry.
Intro to OpenTelemetry
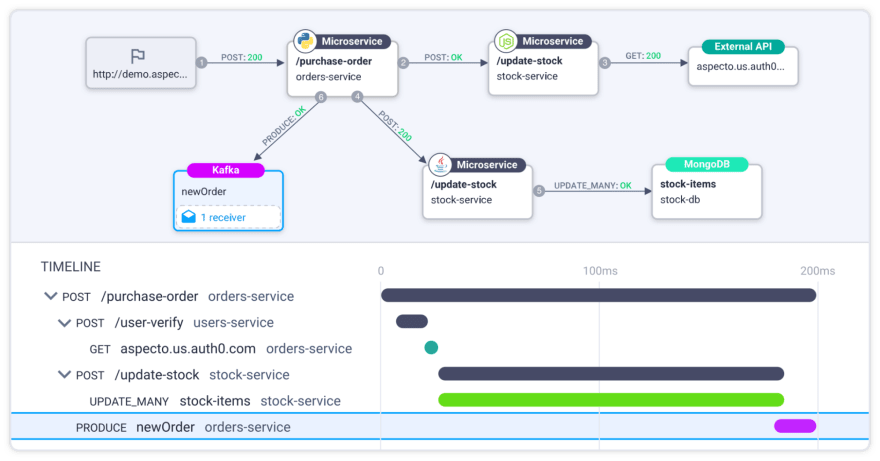
OpenTelemetry is a CNCF project (same folks responsible for Kubernetes), which, among other things, allows the collection of traces, logs, and metrics (also known as the three pillars of observability).
It enables us to instrument our distributed services, meaning, to collect data from the events that happen in our systems which ultimately help us understand our softwares performance and behavior.
OpenTelemetry has been widely covered in various posts You can learn more about OpenTelemetry and distributed tracing here.
For this guide (and for using OpenTelemetry), here are the relevant terms you must be familiar with:
Span: The basic building block (I like to call it the atom) of OpenTelemetry.
A span is an action that occurs in our system, like a POST/GET request or a db.insert operation.
Trace: A trace is a tree of spans representing the progression of a single request as it is handled by the different services of your app.
Exporter: Once we have created a span we need to send it to some backend. It may be in memory, Jaeger, or even as console output. The exporter handles sending the data to our backend.
Manual / Automatic instrumentation:
- Manual: manually creating a span inside the application code
- Automatic: using instrumentation libraries (like pymongo for mongodb), to automatically create spans for us and send them to the backend through the exporter.
If you want to learn more terms, you can see the official documentation related to this here: https://opentelemetry.io/docs/concepts/data-sources/
If you want to learn about the advantages of tracing and their comparison to logs, check out this guide.
Hello World: OpenTelemetry Python
Create spans and see them in the console output:
Lets begin by writing some simple code that creates manual spans and logs them to console output.
1.Start a new python project (python 3.6+ is supported by OpenTelemetry)
2.Make the following installs
pip install opentelemetry-apipip install opentelemetry-sdk3.Create a tracing.py file with 2 manual spans created rootSpan and childSpan.
# tracing.pyfrom opentelemetry import tracefrom opentelemetry.sdk.trace import TracerProviderfrom opentelemetry.sdk.trace.export import ( BatchSpanProcessor, ConsoleSpanExporter,)provider = TracerProvider()processor = BatchSpanProcessor(ConsoleSpanExporter())provider.add_span_processor(processor)trace.set_tracer_provider(provider)tracer = trace.get_tracer(__name__)with tracer.start_as_current_span("rootSpan"): with tracer.start_as_current_span("childSpan"): print("Hello world!")Launch the tracing.py file and this is the output you should see 2 manual spans:
{ "name": "childSpan", "context": { "trace_id": "0x6a37f0f0678f07485a01ba001b1119b0", "span_id": "0x4c162caa4e6d10c4", "trace_state": "[]" }, "kind": "SpanKind.INTERNAL", "parent_id": "0xdaf18d32c6af7c38", "start_time": "2022-01-03T14:10:46.601440Z", "end_time": "2022-01-03T14:10:46.601490Z", "status": { "status_code": "UNSET" }, "attributes": {}, "events": [], "links": [], "resource": { "telemetry.sdk.language": "python", "telemetry.sdk.name": "opentelemetry", "telemetry.sdk.version": "1.8.0", "service.name": "unknown_service" }}{ "name": "rootSpan", "context": { "trace_id": "0x6a37f0f0678f07485a01ba001b1119b0", "span_id": "0xdaf18d32c6af7c38", "trace_state": "[]" }, "kind": "SpanKind.INTERNAL", "parent_id": null, "start_time": "2022-01-03T14:10:46.601349Z", "end_time": "2022-01-03T14:10:46.601515Z", "status": { "status_code": "UNSET" }, "attributes": {}, "events": [], "links": [], "resource": { "telemetry.sdk.language": "python", "telemetry.sdk.name": "opentelemetry", "telemetry.sdk.version": "1.8.0", "service.name": "unknown_service" }}Getting Started with OpenTelemetry Python and Jaeger Advancing
Even though our newly created spans are really beautiful in the console, you are (rightfully) not satisfied just by having them. You most likely want to get some visualization of how they play out together.
Thats probably what got you interested in distributed tracing in the first place.
Youll be happy to know about the open-source Jaeger, which is a storage backend for telemetry data that also contains a basic UI for visualizing spans and traces.
Youll even be happier to know that exporting spans to Jaeger is almost as easy as it was to send to our console output.
To send the spans to Jaeger, wed use the OpenTelemetry Jaeger exporter instead of the console span exporter we used before.
Heres how its done:
1.Start a new python project (or keep the same one, as you wish)
2.Run installs:
pip install opentelemetry-exporter-jaeger3.Run Jaeger locally
4.Create a jaeger_tracing.py file with this content:
# jaeger_tracing.pyfrom opentelemetry import tracefrom opentelemetry.exporter.jaeger.thrift import JaegerExporterfrom opentelemetry.sdk.resources import SERVICE_NAME, Resourcefrom opentelemetry.sdk.trace import TracerProviderfrom opentelemetry.sdk.trace.export import BatchSpanProcessortrace.set_tracer_provider( TracerProvider( resource=Resource.create({SERVICE_NAME: "my-hello-service"}) ))jaeger_exporter = JaegerExporter( agent_host_name="localhost", agent_port=6831,)trace.get_tracer_provider().add_span_processor( BatchSpanProcessor(jaeger_exporter))tracer = trace.get_tracer(__name__)with tracer.start_as_current_span("rootSpan"): with tracer.start_as_current_span("childSpan"): print("Hello world!")5.Run the jaeger_tracing.py file
6.Use a browser to go to http://localhost:16686/
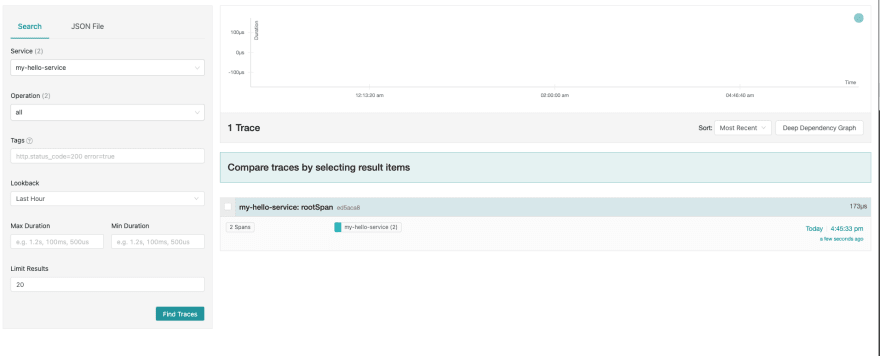
7.You can now see the Jaeger UI. Select my-hello-service and click on Find traces. You should see your trace with rootSpan and childSpan here on the right:
8.After clicking on our rootSpan from the list you can see more details about it which you can further investigate on your own:

An auto instrumentation example
In real life, you would most likely use auto instrumentation more than you would use manual ones. I chose to start with the manual ones as its simpler, to begin with, and understand.
Lets say we have a small script that writes data to a MongoDB database using the PyMongo library.
For us to create and visualize these spans in Jaeger, we would use an automatic instrumentation library forPyMongo.
In this case, its called opentelemetry-pymongo-instrumentation.
First, lets start mongo locally using docker:
docker run -d -p 27017:27017 mongoI have updated our script from before to connect to a DB I created called pytest, and saved a post document in a collection called posts.
After that, it tries to find the exact same document using mongo find_one.
This is the updated code:
from opentelemetry.sdk.trace import TracerProviderfrom opentelemetry.sdk.trace.export import ( BatchSpanProcessor, ConsoleSpanExporter,)from opentelemetry.exporter.jaeger.thrift import JaegerExporterfrom opentelemetry.sdk.resources import SERVICE_NAME, Resourcefrom pymongo import MongoClientfrom opentelemetry.instrumentation.pymongo import PymongoInstrumentorimport datetime# Setup tracingprovider = TracerProvider( resource=Resource.create({SERVICE_NAME: "my-mongo-service"}))jaeger_exporter = JaegerExporter( agent_host_name="localhost", agent_port=6831,)processor = BatchSpanProcessor(ConsoleSpanExporter())provider.add_span_processor(BatchSpanProcessor(jaeger_exporter))PymongoInstrumentor().instrument(tracer_provider=provider)client = MongoClient('mongodb://localhost:27017')db = client.pytestposts = db.posts# insert postpost = {"author": "Tom", "text": "My blog post", "date": datetime.datetime.utcnow()}print('inserting post')post_id = posts.insert_one(post).inserted_idprint('Inserted post with ID:', post_id)# find our newly created postfound_post = posts.find_one({"_id":post_id})print('post is', found_post)If we head back to our Jaeger UI and query for my-mongo-service service, we will see 2 spans have been created. One for inserting the post, and another for finding it.
All are created automatically by the pymongo instrumentation library.

Why are they not in the same trace?
Well, simply because there was no piece of code that was meant to create any span for our script runner.
In real life, you would most likely use some web app framework like Django and instrument it, so that a span would be created for a call to your endpoint, becoming the root span and containing these 2 spans under it. But that use-case is out of the scope of this tutorial.
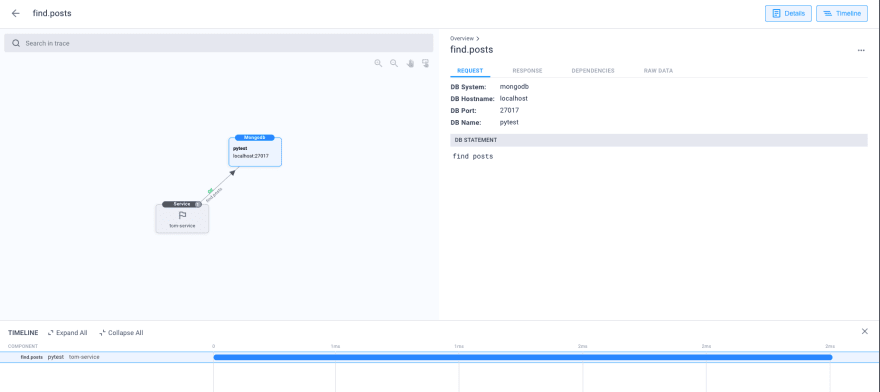
This is what it would look like if we selected the find.posts span in Jaeger:

Bonus: Advanced Visualization with Aspecto
By now you should have a basic understanding of what a span is and how OpenTelemetry can be used to add distributed tracing for code written in Python.
But you probably reached distributed tracing because you wanted to visualize your distributed services and understand them better, which is exactly what Aspecto does.
Give our Live Playground a try to get a better idea its free and no sign-up is required.
At the time of writing this, Aspecto has a free forever plan that you could start using today.
Heres how to do it:
1.First, create a new free account at www.aspecto.io
2.Then, lets install the following packages:
pip install opentelemetry-instrumentationpip install opentelemetry-distropip install opentelemetry-exporter-otlp-proto-grpc3.Modify your python file like this:
# main.pyfrom pymongo import MongoClientimport datetimeclient = MongoClient('mongodb://localhost:27017')db = client.pytestposts = db.posts# insert postpost = {"author": "Tom", "text": "My blog post", "date": datetime.datetime.utcnow()}print('inserting post')post_id = posts.insert_one(post).inserted_idprint('Inserted post with ID:', post_id)# find our newly created postfound_post = posts.find_one({"_id":post_id})print('post is',found_post)Go to Aspecto settings and copy your API keys.
Run like this so that spans are sent to Aspecto:
OTEL_SERVICE_NAME=your-service-name OTEL_EXPORTER_OTLP_TRACES_ENDPOINT=https://otelcol.aspecto.io:4317 OTEL_EXPORTER_OTLP_HEADERS=Authorization=your-aspecto-api-key-here opentelemetry-instrument python main.py
You got yourself a clean list of traces with easy-to-use filters.
Now lets dive into one of the traces by selecting it:
See how you got a nice visualization that your service (a python file in this case) has made a call to mongo with the query find.posts?
Just imagine how it would look in your production, giving you complete visibility on all your microservices as you troubleshoot issues
And that would be it! If you have any questions, feel free to reach out at any time.
P.S. If you want to learn more about OpenTelemetry, you can check out this free, 6 episodes, OpenTelemetry Bootcamp (vendor-neutral).

Its basically your OpenTelemetry playbook where you will learn everything, from the very basics to scaling and deploying to production:
Episode 1: OpenTelemetry Fundamentals
Episode 2: Integrate Your Code (logs, metrics and traces)
Episode 3: Deploy to Production + Collector
Episode 4: Sampling and Dealing with High Volumes
Episode 5: Custom Instrumentation
Episode 6: Testing with OpenTelemetry
Original Link: https://dev.to/aspecto/get-started-with-opentelemetry-python-a-practical-guide-3d3i
Dev To
More About this Source Visit Dev To