
An Interest In:
Web News this Week
- April 24, 2024
- April 23, 2024
- April 22, 2024
- April 21, 2024
- April 20, 2024
- April 19, 2024
- April 18, 2024
Some of Our Sources
- Slashdot
- Joshua Blankenship
- Inspiredology
- My Ink Blog
- CSS Globe
- Line 25
- Stylized Web
- Spyre Studios
- Web Resource Source
- The Verge
Help Webnuz
Referal links:
Monitoring Django application performance with OpenTelemetry | SigNoz
Django is a popular open-source python web framework that enables rapid development while taking out much of the hassle from routine web development. It also helps developers to avoid common security mistakes. As such, many applications are built with Django.
Django is very popular among web developers and has a huge community behind it. It gives web developers ready-to-use components for common things that you will need to accomplish for a web application. Some examples are user authentication, admin panel for your website, forms, etc.
A Django application is built of different components like a web server, database, web server gateway interface, etc. To monitor a Django application for performance, you need to monitor all these components. And thats where OpenTelemetry comes into the picture.
What is OpenTelemetry Django?
OpenTelemetry Django instrumentation enables generation of telemetry data from your Django application. The data is then used to monitor performance of Django application.
OpenTelemetry provides an open-source standard with a consistent collection mechanism and data format. As application owners, you will always have the freedom to choose different vendors to visualize the collected telemetry data.
OpenTelemetry is a set of tools, APIs, and SDKs used to instrument applications to create and manage telemetry data(Logs, metrics, and traces). It aims to make telemetry data(logs, metrics, and traces) a built-in feature of cloud-native software applications.
One of the biggest advantages of using OpenTelemetry is that it is vendor-agnostic. It can export data in multiple formats, which you can send to a backend of your choice.
In this article, we will use SigNoz as a backend. SigNoz is an open-source APM tool built natively for OpenTelemetry and can be used for both metrics and distributed tracing. We will visualize the data captured by OpenTelemetry using SigNoz.
In this article, we will use a sample Django application.
Sample Django application
We will be using a sample poll application which will consist of two parts:
- A public site that lets people view polls and vote in them
- An admin site that lets you add, change and delete polls.
You can find the detailed tutorial on official django website.
 Admin site of the sample Django application
Running Django application with OpenTelemetry
First, you need to install SigNoz. Data collected by OpenTelemetry will be sent to SigNoz for storage and visualization.
You can get started with SigNoz using just three commands at your terminal.
git clone https://github.com/SigNoz/signoz.gitcd signoz/deploy/./install.shThe above instruction is for MacOS and linux distributions. For detailed instructions, you can visit our documentation.

If you have installed SigNoz on your local host, you can access the UI at:http://localhost:3000
The application list shown in the dashboard is from a sample app called HOT R.O.D that comes bundled with the SigNoz installation package.
 SigNoz Dashboard
Instrumenting a sample Django application with OpenTelemetry
Prerequisites
Python 3.8 or newer
Download the latest version of Python.
Running sample Django app
We will be using the Django app at this Github repo. All the required OpenTelemetry and Python packages are contained within the requirements.txt file.
git clone https://github.com/SigNoz/sample-django.gitcd sample-djangoInstalling necessary OpenTelemetry and Python packages
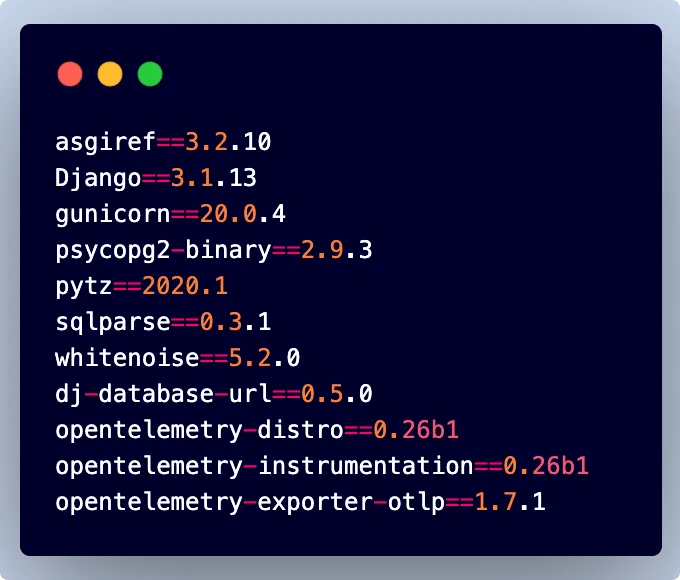
The requirements.txtfile contains all the necessary OpenTelemetry and Python packages needed for instrumentation. In order to install those packages, run the following command:
pip3 install -r requirements.txtHeres a snapshot of packages in the requirements.txt file to run the Django application with OpenTelemetry.
 Packages required for the sample Django application
Install application-specific packages
This step is required to install packages specific to the application. This command figures out which instrumentation packages the user might want to install and installs it for them:
opentelemetry-bootstrap --action=installPrepare your Django app
Now you need to run the following three commands to prepare the sample Django application.
a. This command is used to perform the initial database migration. You will only need to run this the very first time you deploy your app.
python3 manage.py migrateb. This command is used to collect static files from multiple apps into a single path.
python3 manage.py collectstaticc. The following command creates a user who can log in to the admin site. You will be asked to create a username and a password. You will need the username and password to login to the admin portal later.
python3 manage.py createsuperuserThe sample app creates an admin login as shown in the picture below.
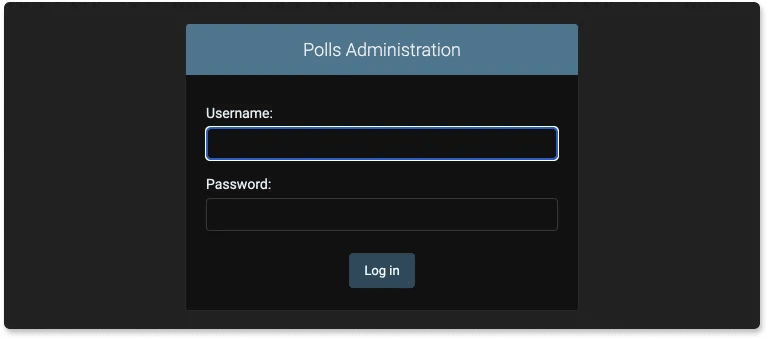 You will need the username and password to log into the admin panel
Configure environment variables to run app and send data to SigNoz
Finally you can run your Django app with OpenTelemetry and send data to SigNoz for monitoring. You can do that in three ways and you can choose whats more suited to you.
a. To run with gunicorn you need to add post_fork hook
To run the sample app with Gunicorn, we have added a file named gunicorn.config.py. In this step, you just need to configure a few environment variables for your OTLP exporters. Environment variables that need to be configured:
- service.nameapplication service name (you can name it as you like)
- OTEL_EXPORTER_OTLP_ENDPOINT- In this case, IP of the machine where SigNoz is installed
- DJANGO_SETTINGS_MODULE
Dont run app in reloader/hot-reload mode as it breaks instrumentation.
DJANGO_SETTINGS_MODULE=<DJANGO_APP>.settings OTEL_RESOURCE_ATTRIBUTES=service.name=<serviceName> OTEL_EXPORTER_OTLP_ENDPOINT="http://<IP OF SigNoz>:4317" opentelemetry-instrument gunicorn <DJANGO_APP>.wsgi -c gunicorn.config.py --workers 2 --threads 2 --reloadAs we are running SigNoz on local host,IP of SigNozcan be replaced withlocalhostin this case. And, forservice_namelet's useDjangoApp. DJANGO_SETTINGS_MODULE for this example is mysite.settings. Hence, the final command becomes:
DJANGO_SETTINGS_MODULE=mysite.settings OTEL_RESOURCE_ATTRIBUTES=service.name=DjangoApp OTEL_EXPORTER_OTLP_ENDPOINT="http://localhost:4317" opentelemetry-instrument gunicorn mysite.wsgi -c gunicorn.config.py --workers 2 --threads 2 --reloadAnd, congratulations! You have enabled OpenTelemetry to capture telemetry data from your Django application. And, you are sending the captured data to SigNoz.
You can check if your app by opening the admin panel athttp://localhost:8000/admin.
If you have installed SigNoz on your local host, then you can access the SigNoz dashboard athttp://localhost:3000to monitor your Django app for performance metrics.
You need to generate some load on your app so that there is data to be captured by OpenTelemetry. Try adding a few questions in the polls app and play around.
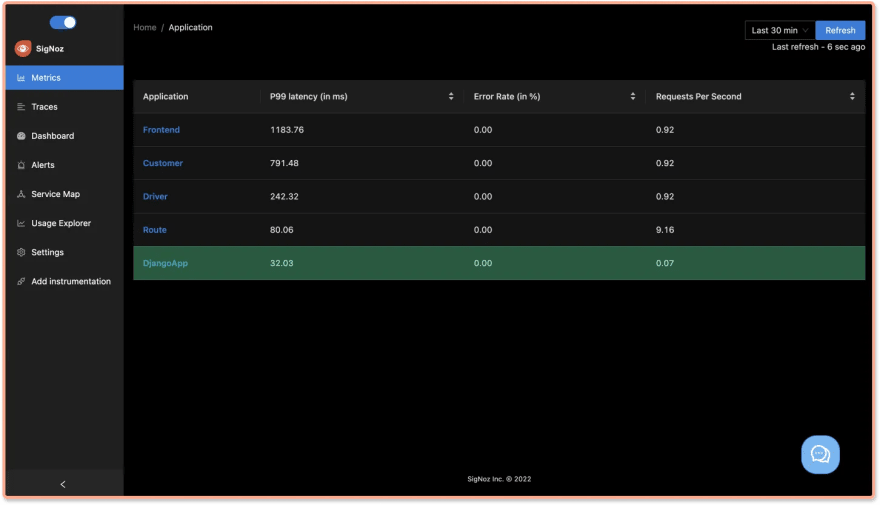 You will find Django application in the list of applications monitored on SigNoz dashboard. The other applications are from a sample app that comes loaded with SigNoz.
There are two other ways to run the Django app with OpenTelemetry using Docker and Docker compose.
b. If want to run docker image of django app directly
docker run --env OTEL_METRICS_EXPORTER=none \ --env OTEL_SERVICE_NAME=djangoApp \ --env OTEL_EXPORTER_OTLP_ENDPOINT=http://<IP of SigNoz>:4317 \ --env DJANGO_SETTINGS_MODULE=mysite.settings \ -p 8000:8000 \ -t signoz/sample-django:latest1 opentelemetry-instrument gunicorn mysite.wsgi -c gunicorn.config.py --workers 2 --threads 2 --reload --bind 0.0.0.0:8000c. If want to use docker image of django app in docker-compose
django-app: image: "signoz/sample-django:latest" container_name: sample-django command: opentelemetry-instrument gunicorn mysite.wsgi -c gunicorn.config.py --workers 2 --threads 2 --reload --bind 0.0.0.0:8000 ports: - "8000:8000" environment: - OTEL_METRICS_EXPORTER=none - OTEL_SERVICE_NAME=djangoApp - OTEL_EXPORTER_OTLP_ENDPOINT=http://otel-collector:4317 - DJANGO_SETTINGS_MODULE=mysite.settingsBrowsing the app and checking data with SigNoz
a. Visithttp://localhost:8000/admin and create a question for poll
b. Then visit the list of polls at http://localhost:8000/polls/ and explore the polls
c. The data should be visible now in SigNoz athttp://<IP of SigNoz>:3000
Open-source tool to visualize telemetry data
SigNoz makes it easy to visualize metrics and traces captured through OpenTelemetry instrumentation.
SigNoz comes with out of box RED metrics charts and visualization. RED metrics stands for:
- Rate of requests
- Error rate of requests
- Duration taken by requests
 Measure things like application latency, requests per sec, error percentage and see your top endpoints with SigNoz.
You can then choose a particular timestamp where latency is high to drill down to traces around that timestamp.
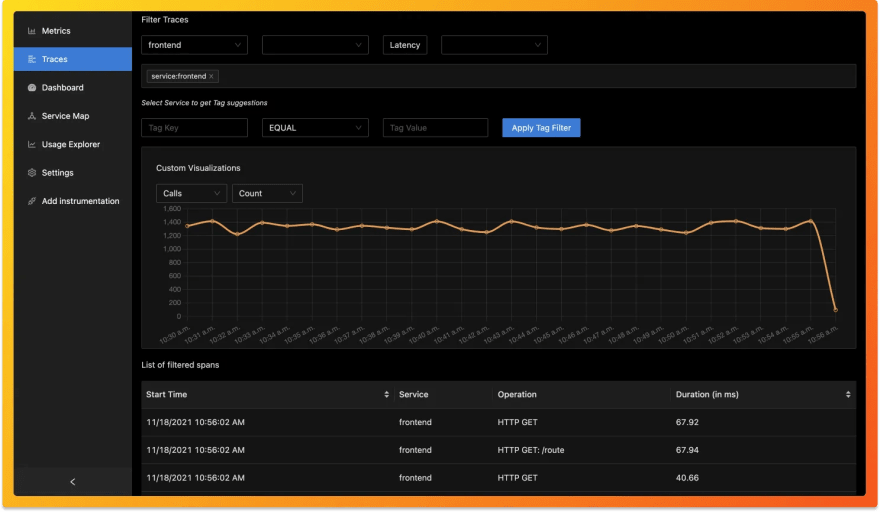 View of traces at a particular timestamp
You can use flamegraphs to exactly identify the issue causing the latency.
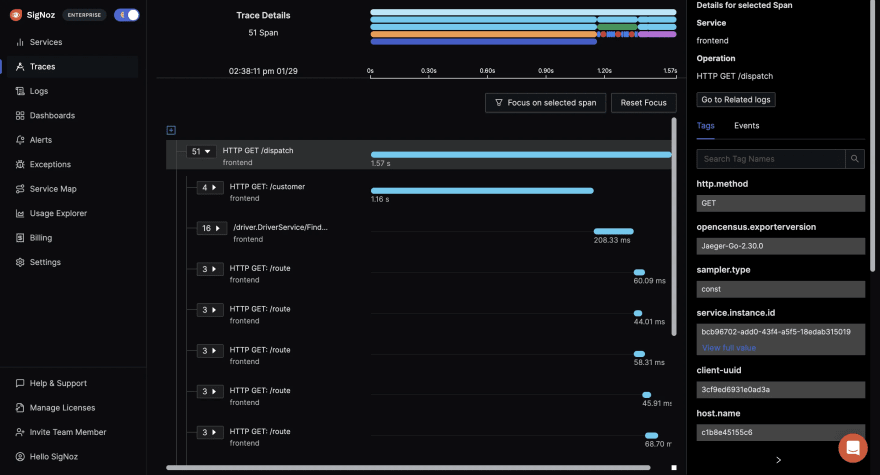 View of traces at a particular timestamp
You can also build custom metrics dashboard for your infrastructure.
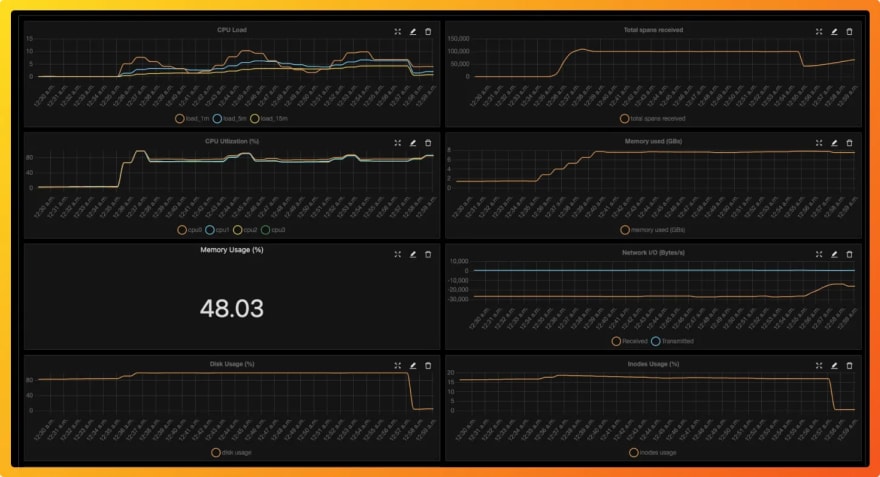 You can also build a custom metrics dashboard for your infrastructure
Conclusion
OpenTelemetry makes it very convenient to instrument your Django application. You can then use an open-source APM tool like SigNoz to analyze the performance of your app. As SigNoz offers a full-stack observability tool, you don't have to use multiple tools for your monitoring needs.
You can try out SigNoz by visiting its GitHub repo
If you have any questions or need any help in setting things up, join our slack community and ping us in #help channel.

If you want to read more about SigNoz
Original Link: https://dev.to/signoz/monitoring-django-application-performance-with-opentelemetry-signoz-4k8m
Dev To
More About this Source Visit Dev To