
An Interest In:
Web News this Week
- March 19, 2024
- March 18, 2024
- March 17, 2024
- March 16, 2024
- March 15, 2024
- March 14, 2024
- March 13, 2024
Some of Our Sources
- Technology Review
- TutsPlus - Code
- Smashing Apps
- Abduzeedo
- TutsPlus - Design
- Vandelay Design
- Noupe
- My Ink Blog
- Web Design Ledger
- Android Dissected
Help Webnuz
Referal links:
Monitoring Rust web application with Prometheus and Grafana
Overview
In this article, Ill show you how to set up monitoring of a Rust web application. The application will expose Prometheus metrics that will be visualized using Grafana. The monitored application is mongodb-redis demo described in detail here. Finally, the following architecture will be obtained:
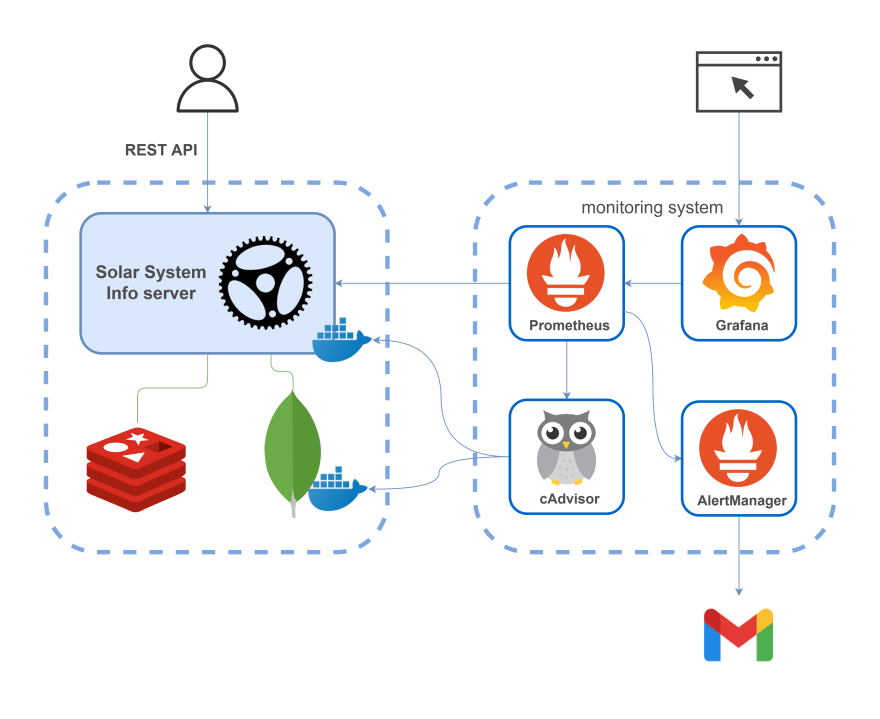
The monitoring system includes:
- Prometheus monitoring platform which collects real-time metrics and records them in a time series database
- Grafana observability and data visualization platform
- AlertManager an application that handles alerts sent by the Prometheus server (for example, when something goes wrong in your application) and notifies an end user through email, Slack, Telegram, or other channels
- cAdvisor a platform providing container users an understanding of the resource usage and performance characteristics of their running containers. (Actually, it gathers information on all Docker containers on the scheme)
To start all the tools at once you can use the following:
version: '3.8'services: prometheus: image: prom/prometheus:latest container_name: prometheus restart: always ports: - '9090:9090' volumes: - ./monitoring/prometheus:/etc/prometheus command: - '--config.file=/etc/prometheus/prometheus.yml' - '--web.external-url=http://localhost:9090' grafana: image: grafana/grafana:latest container_name: grafana restart: always ports: - '3000:3000' volumes: - ./monitoring/grafana/data:/var/lib/grafana - ./monitoring/grafana/provisioning:/etc/grafana/provisioning environment: GF_SECURITY_ADMIN_USER: admin GF_SECURITY_ADMIN_PASSWORD: admin alertmanager: image: prom/alertmanager:latest container_name: alertmanager ports: - '9093:9093' volumes: - ./monitoring/alertmanager:/etc/alertmanager command: - '--config.file=/etc/alertmanager/alertmanager.yml' - '--web.external-url=http://localhost:9093' cadvisor: image: gcr.io/cadvisor/cadvisor:latest container_name: cadvisor restart: always ports: - '8080:8080' volumes: - /:/rootfs:ro - /var/run:/var/run:rw - /sys:/sys:ro - /var/lib/docker/:/var/lib/docker:roExposing Prometheus metrics in a Rust application
Metrics exposition is implemented with prometheus crate.
There are four core types of Prometheus metrics: counter, gauge, histogram, and summary. The first three of them will be described in the article (the crate currently doesnt support summary type).
Metrics definition
Metrics can be created and registered in this way:
Metrics creation and registration
lazy_static! { pub static ref HTTP_REQUESTS_TOTAL: IntCounterVec = register_int_counter_vec!( opts!("http_requests_total", "HTTP requests total"), &["method", "path"] ) .expect("Can't create a metric"); pub static ref HTTP_CONNECTED_SSE_CLIENTS: IntGauge = register_int_gauge!(opts!("http_connected_sse_clients", "Connected SSE clients")) .expect("Can't create a metric"); pub static ref HTTP_RESPONSE_TIME_SECONDS: HistogramVec = register_histogram_vec!( "http_response_time_seconds", "HTTP response times", &["method", "path"], HTTP_RESPONSE_TIME_CUSTOM_BUCKETS.to_vec() ) .expect("Can't create a metric");}In the code snippet above, custom metrics are added to the default registry; it is also possible to register them in a custom registry (see example).
Further, the purpose and usage of the metrics will be described in detail.
Counter
If we want to count all incoming HTTP requests, it is possible to use IntCounter type. But it is more useful to see not just the total number of requests, but also some other dimensions, such as a path and a method of a request. That can be done with IntCounterVec; HTTP_REQUESTS_TOTAL of the type is used in custom Actix middleware as follows:
Usage of HTTP_REQUESTS_TOTAL metric
let request_path = req.path();let is_registered_resource = req.resource_map().has_resource(request_path);// this check prevents possible DoS attacks that can be done by flooding the application// using requests to different unregistered paths. That can cause high memory consumption// of the application and Prometheus server and also overflow Prometheus's TSDBif is_registered_resource { let request_method = req.method().to_string(); metrics::HTTP_REQUESTS_TOTAL .with_label_values(&[&request_method, request_path]) .inc();}After making some requests to API, something like the following will be produced:
Output of HTTP_REQUESTS_TOTAL metric
# HELP http_requests_total HTTP requests total# TYPE http_requests_total counterhttp_requests_total{method="GET",path="/"} 1http_requests_total{method="GET",path="/events"} 1http_requests_total{method="GET",path="/metrics"} 22http_requests_total{method="GET",path="/planets"} 20634Each sample of the metric has method and path labels (the metrics attributes), so Prometheus can differentiate the samples.
As is shown in the previous snippet, requests to GET /metrics (endpoint from which Prometheus server collects metrics of an application) are also observed.
Gauge
Gauge differs from the counter by the fact that its value can go down. The example of the gauge shows how many clients at present are connected using SSE. The gauge is used as follows:
Usage of HTTP_CONNECTED_SSE_CLIENTS metric
crate::metrics::HTTP_CONNECTED_SSE_CLIENTS.inc();crate::metrics::HTTP_CONNECTED_SSE_CLIENTS.set(broadcaster_mutex.clients.len() as i64)If you navigate to http://localhost:9000 in your browser, connection over SSE will be established and the metric will be incremented. After that, its output will look like this:
Output of HTTP_CONNECTED_SSE_CLIENTS metric
# HELP http_connected_sse_clients Connected SSE clients# TYPE http_connected_sse_clients gaugehttp_connected_sse_clients 1Broadcaster
To implement SSE clients gauge it was needed to refactor the code of the application and implement broadcaster. It stores all connected (using sse function) clients in a vector and periodically pings each of them (in remove_stale_clients function) to make sure that the connection is still alive otherwise removing disconnected clients from the vector. The broadcaster allows opening just one Redis Pub/Sub connection; messages from it are sent (broadcasted) to all the clients.
Histogram
In this guide, histogram is used to collect data on response times. As in the case of request counter, tracking is done in Actix middleware; it is implemented using the following code:
...histogram_timer = Some( metrics::HTTP_RESPONSE_TIME_SECONDS .with_label_values(&[&request_method, request_path]) .start_timer(),);...if let Some(histogram_timer) = histogram_timer { histogram_timer.observe_duration();};I think this approach is not precise (the question is how less is this time than the actual response time) but nevertheless the observation data will be useful as an example of a histogram and for its further visualization in Grafana.
A histogram samples observations and counts them in configurable buckets (there are default buckets but most likely you will be required to define buckets customized to your use case); to configure them it is nice to know approximate spread of a metrics values. In this application response time is quite small so the following configuration is used:
const HTTP_RESPONSE_TIME_CUSTOM_BUCKETS: &[f64; 14] = &[ 0.0005, 0.0008, 0.00085, 0.0009, 0.00095, 0.001, 0.00105, 0.0011, 0.00115, 0.0012, 0.0015, 0.002, 0.003, 1.0,];The output will look like this (only a part of data is shown to save space):
Output of HTTP_RESPONSE_TIME_SECONDS metric
# HELP http_response_time_seconds HTTP response times# TYPE http_response_time_seconds histogramhttp_response_time_seconds_bucket{method="GET",path="/planets",le="0.0005"} 0http_response_time_seconds_bucket{method="GET",path="/planets",le="0.0008"} 6http_response_time_seconds_bucket{method="GET",path="/planets",le="0.00085"} 1307http_response_time_seconds_bucket{method="GET",path="/planets",le="0.0009"} 10848http_response_time_seconds_bucket{method="GET",path="/planets",le="0.00095"} 22334http_response_time_seconds_bucket{method="GET",path="/planets",le="0.001"} 31698http_response_time_seconds_bucket{method="GET",path="/planets",le="0.00105"} 38973http_response_time_seconds_bucket{method="GET",path="/planets",le="0.0011"} 44619http_response_time_seconds_bucket{method="GET",path="/planets",le="0.00115"} 48707http_response_time_seconds_bucket{method="GET",path="/planets",le="0.0012"} 51495http_response_time_seconds_bucket{method="GET",path="/planets",le="0.0015"} 57066http_response_time_seconds_bucket{method="GET",path="/planets",le="0.002"} 59542http_response_time_seconds_bucket{method="GET",path="/planets",le="0.003"} 60532http_response_time_seconds_bucket{method="GET",path="/planets",le="1"} 60901http_response_time_seconds_bucket{method="GET",path="/planets",le="+Inf"} 60901http_response_time_seconds_sum{method="GET",path="/planets"} 66.43133770000004http_response_time_seconds_count{method="GET",path="/planets"} 60901The data show numbers of observations falling into particular buckets of observation values. The output also provides information on total count and sum of observations.
System metrics
process feature enables exporting of process metrics such as CPU or memory usage. All you need is just to specify the feature in Cargo.toml. After that, you will get something like this:
Output of process metrics
# HELP process_cpu_seconds_total Total user and system CPU time spent in seconds.# TYPE process_cpu_seconds_total counterprocess_cpu_seconds_total 134.49# HELP process_max_fds Maximum number of open file descriptors.# TYPE process_max_fds gaugeprocess_max_fds 1048576# HELP process_open_fds Number of open file descriptors.# TYPE process_open_fds gaugeprocess_open_fds 37# HELP process_resident_memory_bytes Resident memory size in bytes.# TYPE process_resident_memory_bytes gaugeprocess_resident_memory_bytes 15601664# HELP process_start_time_seconds Start time of the process since unix epoch in seconds.# TYPE process_start_time_seconds gaugeprocess_start_time_seconds 1636309802.38# HELP process_threads Number of OS threads in the process.# TYPE process_threads gaugeprocess_threads 6# HELP process_virtual_memory_bytes Virtual memory size in bytes.# TYPE process_virtual_memory_bytes gaugeprocess_virtual_memory_bytes 439435264Note that prometheus crate supports exporting process metrics of an application running on Linux (for example in such a Docker container).
Endpoint for metrics exposition
Actix is configured to process GET /metrics requests using this handler:
pub async fn metrics() -> Result<HttpResponse, CustomError> { let encoder = TextEncoder::new(); let mut buffer = vec![]; encoder .encode(&prometheus::gather(), &mut buffer) .expect("Failed to encode metrics"); let response = String::from_utf8(buffer.clone()).expect("Failed to convert bytes to string"); buffer.clear(); Ok(HttpResponse::Ok() .insert_header(header::ContentType(mime::TEXT_PLAIN)) .body(response))}Now, after the successful configuration of the application, you can get all previously described metrics by executing GET http://localhost:9000/metrics request. The endpoint is used by the Prometheus server to collect metrics of the application.
Metrics are exposed in a simple text-based format.
Prometheus setup for metrics gathering
Prometheus collects (scrapes) metrics using the following config:
Prometheus config for metrics gathering
scrape_configs: - job_name: mongodb_redis_web_app scrape_interval: 5s static_configs: - targets: ['host.docker.internal:9000'] - job_name: cadvisor scrape_interval: 5s static_configs: - targets: ['cadvisor:8080']In the config, two jobs are specified. The former job collects previously described metrics of the application, the latter collects resource usage and performance metrics of running containers (that will be described in detail in the section about cAdvisor). scrape_interval specifies how frequently to scrape a target. metrics_path parameter is not specified so Prometheus expects metrics to be available on targets on a path of /metrics.
Expression browser and graphing interface
To use Prometheuss built-in expression browser, navigate to http://localhost:9090/graph and try to query any of the previously described metrics, for example, http_requests_total. Use the "Graph" tab to visualize the data.
PromQL allows you to make more complex queries; lets consider a couple of examples.
- return all time series with the metric
http_requests_totaland the given job:
http_requests_total{job="mongodb_redis_web_app"}
job and instance labels are attached automatically to the scraped time series by the Prometheus server.
- return per-second rate of incoming requests, as measured over the last 5 minutes:
rate(http_requests_total[5m])
You can find more examples here.
Grafana setup for metrics visualization
In this project, Grafana is configured with the following:
- data sources (from where Grafana will request data)
Data sources config of Grafana
``` yamlapiVersion: 1datasources: - name: Prometheus type: prometheus access: proxy url: prometheus:9090 isDefault: true```- dashboards provider (from where Grafana will load dashboards)
Dashboards config of Grafana
``` yamlapiVersion: 1providers: - name: 'default' folder: 'default' type: file allowUiUpdates: true updateIntervalSeconds: 30 options: path: /etc/grafana/provisioning/dashboards foldersFromFilesStructure: true```After launching the project as was specified in Docker Compose file, you can go to http://localhost:3000/, log in with admin/admin credentials, and find webapp_metrics dashboard. A little bit later, it will look like this:

The dashboard displays the state of the application under easy load test. (If you will launch some load test, for better visibility of the graphs (particularly the histogram) you will need to disable somehow MAX_REQUESTS_PER_MINUTE restriction, for example, by a sharp increase of that number.)
To visualize the data, the dashboard uses PromQL queries that utilize previously described metrics, for example:
rate(http_response_time_seconds_sum[5m]) / rate(http_response_time_seconds_count[5m])
Shows average response time for the last five minutes
sum(increase(http_response_time_seconds_bucket{path="/planets"}[30s])) by (le)
Is used to visualize response time distribution in the form of a heatmap. A heatmap is like a histogram, but over time, where each time slice represents its own histogram
rate(process_cpu_seconds_total{job="mongodb_redis_web_app"}[1m]),sum(rate(container_cpu_usage_seconds_total{name='mongodb-redis'}[1m])) by (name)
Shows CPU usage for the last five minutes. Requested data are coming from two different sources and show CPU usage of the process and the container respectively. The two graphs are almost identical. (sum is used because container_cpu_usage_seconds_total provides information on the usage of each core.)
Note: "Memory usage" graph shows memory used by:
- the process (
process_resident_memory_bytes{job="mongodb_redis_web_app"} / 1024 / 1024) - the container (
container_memory_usage_bytes{name="mongodb-redis"} / 1024 / 1024)
For an unknown reason, the graph shows that the process consumes much more memory than the whole container. Also, I created an issue on this question. Please, let me know if theres something wrong with that comparison or if you know how this can be explained.
Monitoring metrics of application container using cAdvisor
In addition to system metrics of a process (was shown previously), system metrics of the Docker container can also be exported. This can be done using cAdvisor.
Web UI of cAdvisor is accessible via http://localhost:8080/. All running Docker containers are shown at http://localhost:8080/docker/:

You can get information on resource usage of any container:

Metrics are gathered by the Prometheus server from http://localhost:8080/metrics.
Metrics exported by cAdvisor are listed here.
System metrics of machines can be exported with Node exporter or Windows exporter.
Setup of alert notifications using rules and AlertManager
In this project, the following part of Prometheus config is responsible for alerting:
Prometheus config for alerting
rule_files: - 'rules.yml'alerting: alertmanagers: - static_configs: - targets: ['alertmanager:9093']The alerting section defines the AlertManager instance Prometheus server communicates with.
Alerting rules allow you to define some conditions based on PromQL expressions:
Example of an alerting rule in rules.yml
groups:- name: default rules: - alert: SseClients expr: http_connected_sse_clients > 0 for: 1m labels: severity: high annotations: summary: Too many SSE clients- alert a name of the alert
- expr the actual rule definition in the form of Prometheus expression
- for how long the rule needs to be broken before raising an alert. In our case, if the number of SSE clients remains greater than 0 for 1 minute, an alert will be raised
- labels extra information that can be attached to the alert, e.g. severity
- annotations extra descriptions that can be attached to the alert, e.g. summary
This rule of SSE clients number greater than 0 isnt something you would typically setup for your application. It is used as an example as it will be easy for us to break the rule by making just one request.
If the rule is broken, the Prometheus server will send an alert to the AlertManager instance. It provides numerous features, such as alerts deduplication, grouping, silencing, and dispatching notifications to an end user. We will consider only routing ability: the alert will be dispatched to an email.
AlertManager is configured as follows:
route: receiver: gmailreceivers:- name: gmail email_configs: - to: [email protected] from: [email protected] smarthost: smtp.gmail.com:587 auth_username: [email protected] auth_identity: [email protected] auth_password: passwordIn this project, AlertManager is configured with a Gmail account. To generate an app password, you can use this guide.
To trigger SseClients alerting rule, you just need to navigate to http://localhost:9000 in your browser. This will increase http_connected_sse_clients metric by 1. You can track the status of the SseClients alert on http://localhost:9090/alerts. After the triggering, the alert will go to the Pending status. After the for interval defined in rules.yml has passed (in our case 1 minute), the alert will go to the Firing status.

That will cause the Prometheus server sending the alert to AlertManager. It will decide what to do with the alert, in our case sending an email:

Monitoring third-party systems using Prometheus exporters
For third-party tools, such as MongoDB, Redis, and many others, it is possible to set up monitoring using Prometheus exporters.
Launch
docker compose up --build
Conclusion
In this article, I showed how to setup metrics exposition in a Rust web application, their gathering with Prometheus, and data visualization with Grafana. Also, it was shown how to start working with cAdvisor to gather containers' metrics and with alerting using AlertManager. Feel free to contact me if you have found any mistakes in the article or the source code. Thanks for reading!
Useful links
Original Link: https://dev.to/rkudryashov/monitoring-rust-web-application-with-prometheus-and-grafana-4i9f
Dev To
More About this Source Visit Dev To