
An Interest In:
Web News this Week
- March 21, 2024
- March 20, 2024
- March 19, 2024
- March 18, 2024
- March 17, 2024
- March 16, 2024
- March 15, 2024
Some of Our Sources
- BoingBoing
- Techcrunch
- The Logo Smith
- Abduzeedo
- You The Designer
- Web Designer Depot
- Line 25
- Android Headlines
- Willems Lab
- TechPowerUp
Help Webnuz
Referal links:
GraphQL Postgres Metrics Dashboard with Cube
You're bound to have heard the term GraphQL. Unless you live under a rock. I doubt that though. GraphQL is a query language for APIs and a runtime for fulfilling those queries with your existing data.
This tutorial will show you a step-by-step guide on how to use a GraphQL API to build Postgres metrics dashboards.
Here's what the end product will look like. You can also check out the live preview.

GraphQL provides a complete and understandable description of the data in your API, gives clients the power to ask for exactly what they need and nothing more. GraphQL makes it easier to evolve APIs over time and enables powerful developertools.
The incredible growth in GraphQL's popularity has been noticed by the amazing Cube community. Our community longed for a GraphQL integration, and we listened.
How the GraphQL API was added to Cube
I'd like to give a huge shout-out to Luc Vauvillier who contributed initial support for the GraphQL API and laid out the principal design. Luc is the co-founder at Gadsme. Check this out to read more about how Gadsme builds awesome stuff with Cube.
We at Cube were thrilled to jump on the problem at hand and build out a GraphQL API. As of the 0.29 release of Cube, you can use the GraphQL API!
Set up Cube with GraphQL and Postgres
To configure Cube, I first needed to connect a database. I used a demo Postgres database with e-commerce data. The process of connecting a database is identical whether you're using a self-hosted instance of Cube, or Cube Cloud.
I selected PostgreSQL from the list of database options. Cube supports dozens of databases, you can select from any mainstream database or data warehouse on the market.

Next, I had to add values to connect to my sample PostgreSQL e-commerce database. If you're using a self-hosted Cube instance, you need to configure a few environment variables.
In Cube Cloud, it looks like this.

Once the connection is established, I have to generate a data schema. Selecting the public table and clicking generate will build a Cube data schema for me to work with.

Now I have access to my Cube cluster. In Cube Cloud you should always enable cluster mode for improved performance if you want to run reliably in production.
This will make sure your resources will autoscale based on the load. There's no additional cost for autoscaling, and the pricing model for Cube Cloud is based on throughput.

Next up, I ran a set of queries in the Cube Playground to determine what data I need to make the metrics dashboard.
First of all, I want to run a sample query to list orders by status grouped by day.

Let's open up the Cube GraphiQL interface and run this same query with GraphQL. You can read more about the GraphQL API in our docs.
Here's what the GraphQL query looks like for the example above.

query CubeQuery { cube(limit: 10) { orders(orderBy: { count: desc }) { count status createdAt { day } } }}Running this query in GraphiQL will return the values just like in the playground. Now we're done with the setup, let's move on to some more complex queries.
Running Analytical GraphQL Queries
Lets add a where clause with a time dimension to the GraphQL query.
query CubeQuery { cube( limit: 10 where: { orders: { createdAt: { inDateRange: "This year" } } } ) { orders(orderBy: { count: desc }) { count status createdAt { day } } }}Running this query in GraphiQL will return this result set.

I also want to run another query with only completed order statuses.
query CubeQuery { cube( limit: 10 where: { orders: { status: { equals: "completed" } createdAt: { inDateRange: "This year" } } } ) { orders(orderBy: { count: desc }) { count status createdAt { day } } }}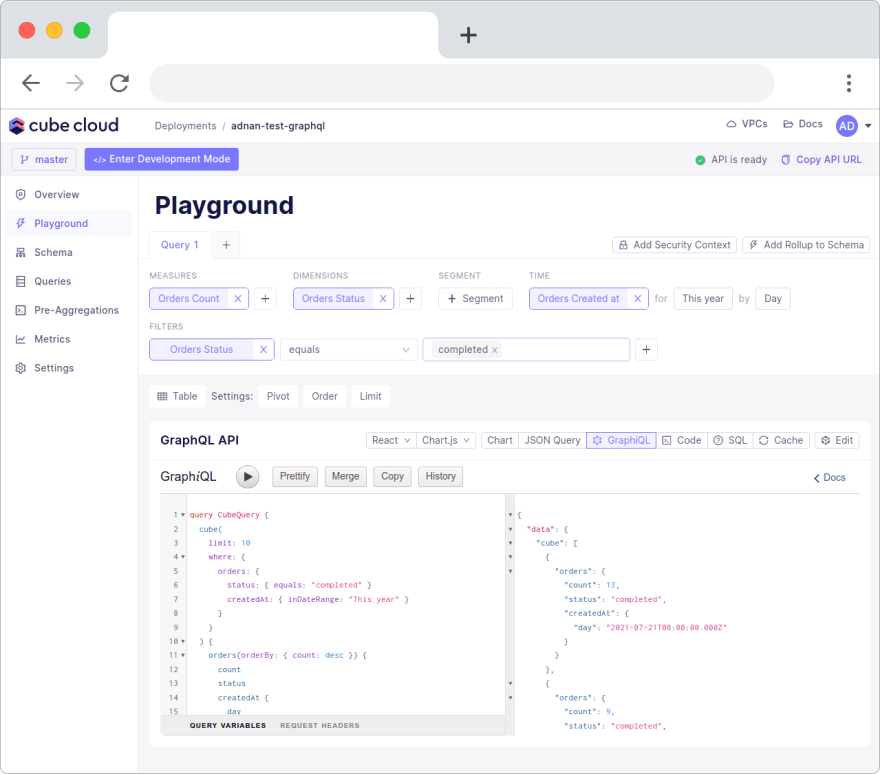
These queries will be perfect for building my metrics dashboard. Next, we need to build an app to display the metrics.
Visualize Postgres Data with GraphQL
I'll start by building a React app and using Chart.js to display the metrics.
npx create-react-app dashboard-appcd dashboard-appyarn add @apollo/client graphql chart.js react-chartjs-2 apollo-link-httpnpm startThis will give me a blank React app. I then add the Apollo client and all the required dependencies for building the charts.
Next up, create the filesrc/ApolloClient/client.jsand insert the following code.
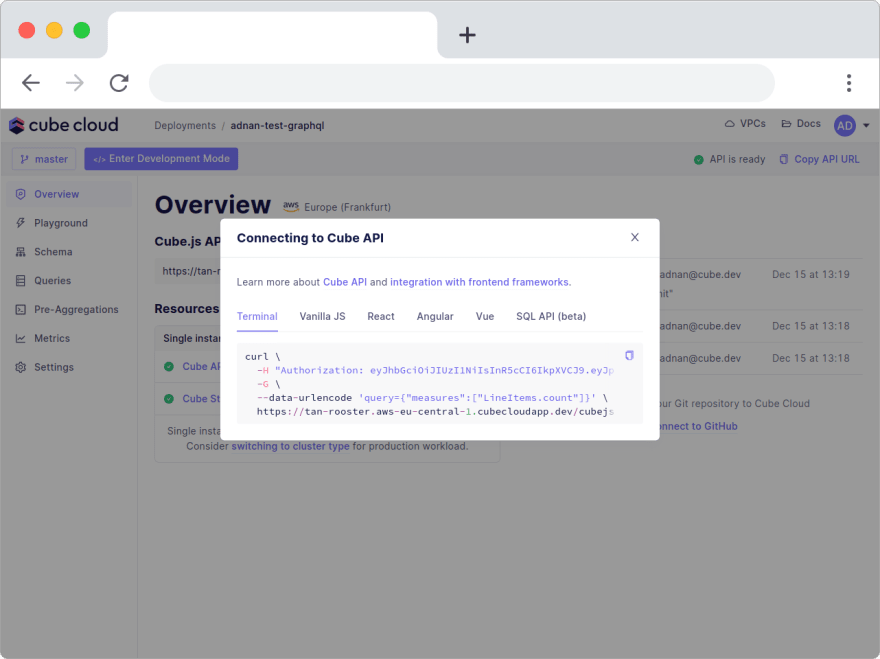
import { ApolloClient, ApolloLink, InMemoryCache } from "@apollo/client";import { HttpLink } from "apollo-link-http";const uri = 'https://tan-rooster.aws-eu-central-1.cubecloudapp.dev/cubejs-api/graphql'const httpLink = new HttpLink({ uri });let appJWTToken = 'eyJhbGciOiJIUzI1NiIsInR5cCI6IkpXVCJ9.eyJpYXQiOjE2Mzk1Nzc2NTh9.ARCF3pyi9rpNAPEF2rBoP-EKjzfJQX1q3X7A3qCDoYc';const authMiddleware = new ApolloLink((operation, forward)=> { if (appJWTToken) { operation.setContext({ headers: { Authorization: `${appJWTToken}` } }); } return forward(operation);});export const clientWithCubeCloud = new ApolloClient({ cache: new InMemoryCache(), link: authMiddleware.concat(httpLink),});Make sure to edit your uri and appJWTToken to use your values from Cube Cloud. You can get those values from the Overview tab by clicking the How to connect button.
Now you have to make the Apollo client available to the rest of your app. Update yoursrc/index.jsto look as follows.
import React from 'react';import ReactDOM from 'react-dom';import './index.css';import App from './App';import reportWebVitals from './reportWebVitals';import { client } from './ApolloClient/client';import { ApolloProvider } from '@apollo/client';ReactDOM.render( <ApolloProvider client={client}> <App /> </ApolloProvider>, document.getElementById('root'));// If you want to start measuring performance in your app, pass a function// to log results (for example: reportWebVitals(console.log))// or send to an analytics endpoint. Learn more: https://bit.ly/CRA-vitalsreportWebVitals();Nice! Now you can move on to create the chart component, and then call the GraphQL query from the chart itself.
Create a folder called src/Charts and create a file called src/Charts/BarChart.js. Paste this code into it.
import React from "react";import { gql, useQuery } from '@apollo/client';import { getRandomColor, formatDate } from './Helpers'import { Bar } from 'react-chartjs-2';import { Chart as ChartJS, BarElement, Title, CategoryScale, LinearScale, Tooltip, Legend } from 'chart.js';ChartJS.register(BarElement, Title, CategoryScale, LinearScale, Tooltip, Legend);const COMPLETEDORDERS = gql` query CubeQuery { cube( limit: 10 where: { orders: { status: { equals: "completed" } createdAt: { inDateRange: "This year" } } } ) { orders(orderBy: { count: desc }) { count status createdAt { day } } } }`;const GenerateChart = () => { const { data, loading, error } = useQuery(COMPLETEDORDERS); if (loading) { return <div>loading</div>; } if (error) { return <div>{error}</div>; } if (!data) { return null; } const chartData = { labels: ['Daily Completed Orders in 2021'], datasets: data.cube .map(o => o.orders) .map(o => { return { data: [o.count], label: formatDate(new Date(o.createdAt.day)), backgroundColor: [getRandomColor()], }; }) } return ( <Bar data={chartData} /> );}const BarChart = () => { return ( <div style={{ margin: "10px", paddingTop: "65px" }}> <h2 style={{ margin: "10px", textAlign: "center" }}> Bar Chart </h2> <div style={{ margin: "10px 100px", padding: "10px 100px" }}> <GenerateChart /> </div> </div> );};export { BarChart };You'll also need to create a file called src/Charts/Helpers.js. Paste this code.
function getRandomColor() { function hexToRgbA(hex){ let c; if(/^#([A-Fa-f0-9]{3}){1,2}$/.test(hex)){ c= hex.substring(1).split(''); if(c.length === 3){ c= [c[0], c[0], c[1], c[1], c[2], c[2]]; } c= '0x'+c.join(''); return 'rgba('+[(c>>16)&255, (c>>8)&255, c&255].join(',')+',0.5)'; } throw new Error('Bad Hex'); } const letters = '0123456789ABCDEF'; let color = '#'; for (let i = 0; i < 6; i++) { color += letters[Math.floor(Math.random() * 16)]; } return hexToRgbA(color);}function formatDate(date) { let d = new Date(date), month = '' + (d.getMonth() + 1), day = '' + d.getDate(), year = d.getFullYear(); if (month.length < 2) month = '0' + month; if (day.length < 2) day = '0' + day; return [day, month, year].join('-');}export { getRandomColor, formatDate};Once you're done with that, you need to create a file called src/Charts/index.js to export the chart.
export { BarChart } from './BarChart';Lastly, edit the App.js and import the chart.
import './App.css';import { BarChart,} from './Charts';function App() { return ( <div className="App"> <BarChart /> </div> );}export default App;Go back to the browser where the React app is running. You should see this fancy chart pop up!
As of today, this means you can use Cube's GraphQL API for building any type of metrics dashboard. Alongside the REST API and SQL API, you have an entire toolset at your disposal to choose from.
But I'm not done here yet. Let's add some role-based access control, also called RBAC.
Add Role-Based Access Control with JWT Tokens
You get multi-tenancy and RBAC in Cube out of the box. Let's add a security context in the Apollo client to enable RBAC.
Just like with the REST API you can add security and RBAC with JWT tokens. First open up the Env vars tab in your Cube Cloud deployment settings.

Find the CUBEJS_API_SECRET environment variable and copy it. This is the API secret that secures your API. Take the value and create a JWT token with jwt.io , make sure to add { "role": "admin" } to the payload.

You can now copy the JWT token and open up the src/ApolloClient/client.js file. Add the token value to the appJWTToken variable. Here's what it should look like.
import { ApolloClient, ApolloLink, InMemoryCache } from "@apollo/client";import { HttpLink } from "apollo-link-http";const uri = 'http://localhost:4000/cubejs-api/graphql'const httpLink = new HttpLink({ uri });let appJWTToken = 'eyJhbGciOiJIUzI1NiIsInR5cCI6IkpXVCJ9.eyJyb2xlIjoiYWRtaW4ifQ.FUewE3jySlmMD3DnOeDaMPBqTqirLQeuRG_--O5oPNw';const authMiddleware = new ApolloLink((operation, forward)=> { if (appJWTToken) { operation.setContext({ headers: { Authorization: `${appJWTToken}` } }); } return forward(operation);});export const clientWithJwt = new ApolloClient({ cache: new InMemoryCache(), link: authMiddleware.concat(httpLink),});Next, add the security context and RBAC to the cube.js file.
// Cube.js configuration options: https://cube.dev/docs/configmodule.exports = { queryRewrite: (query, { securityContext }) => { if (!securityContext.role) { throw new Error('No role found in Security Context!'); } if (!securityContext.role === 'admin') { throw new Error('You\'re not the Admin!'); } return query; },};Here's what it looks like in Cube Cloud.

You can add any particular logic you might want like RBAC, multi-tenancy, row-level access, and more.
Now, jump back to the dashboard-app. Restart it, and voila, you've added RBAC. The end outcome is this lovely chart showing orders per day for the whole of 2021 that you can only access with the admin role. If you remove the appJWTToken, your dashboard-app won't be able to fetch data anymore.
If you want to check out the source code in one place, here's the GitHub repo. And, you can also have a look at the live preview here.
Conclusion
In this tutorial, I wanted to show a step-by-step guide on how to use Cube's GraphQL API to build a metrics dashboard with data from a Postgres database.
With Cube Cloud you get a metrics layer that integrates with every major data visualization library including GraphQL compatible tools like Chart.js and react-chartjs-2. On top of all that, it also comes with multi-tenancy support out-of-the-box. Among the different multi-tenancy options, you can enable tenant-based row-level security, role-based access, using multiple database instances, multiple schemas, and more.
If you want to learn more about GraphQL withCubecheck out our announcement that explains how we added the GraphQL API to Cube.
You canregister for Cube Cloudright away if you want to have a look!
I'd love to hear your feedback about using GraphQL with Cube Cloud in the Cube Community Slack.Click here to join!
Until next time, stay curious, and have fun coding. Also, feel free toleave Cube a on GitHubif you liked this article.
Original Link: https://dev.to/cubejs/graphql-postgres-metrics-dashboard-with-cube-4dk8
Dev To
More About this Source Visit Dev To