
An Interest In:
Web News this Week
- March 21, 2024
- March 20, 2024
- March 19, 2024
- March 18, 2024
- March 17, 2024
- March 16, 2024
- March 15, 2024
Some of Our Sources
- Techcrunch
- Pearsonified
- Smashing Magazine
- Fuel Your Creativity
- Crazy Leaf Design
- 24 Ways
- Stylized Web
- Spyre Studios
- Web Resource Source
- Dev To
Help Webnuz
Referal links:
Building a coordinate system in CSS and HTML
I developed a dynamic cartesian coordinate system. It may be a bit basic, but I find it interesting because you can plug in many different functions and display the points correctly. All while having some interesting features:
- Customizable: pick the colors, size, ranges, center of the system, etc.
- Responsive: 100% of the parent width by default, but it can have relative/absolute sizes.
- Easy-to-use: straightforward translation of functions to CSS.
- Lightweight: 35 lines of CSS and a line of HTML for each point to be displayed. No JavaScript.
Yes, you read right: it doesn't use JavaScript to do the function calculations. Instead, it's all in CSS with the calc() method.
Article contents:
Introduction
A weekend in September Yes, I've had the article written since then but never published it , I woke up early, and taking advantage that everyone else in the house was still sleeping, I decided to play with HTML and CSS. Looking at Twitter, I found this tweet by Lea Verou:
 Lea Verou@leaverou
 Ever struggled to transform a range of values of a custom property to a different range of values via calc()?
I made a little app for that!
codepen.io/leaverou/pen/b
(Hopefully I can write a detailed blog post once Im less busy)17:59 PM - 25 Sep 2021


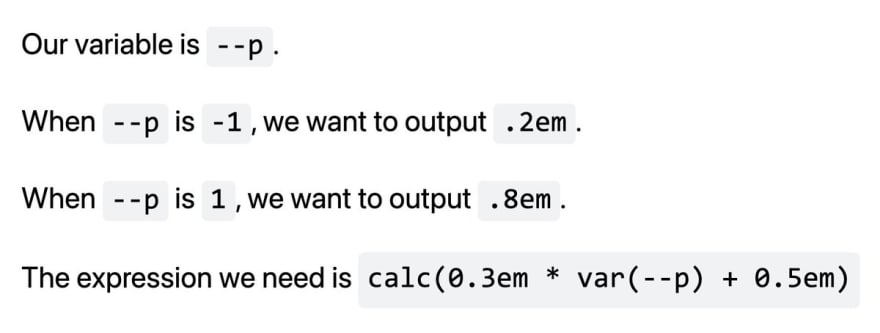
She uses calc() to generate a range of values following a linear function. It is an interesting approach that uses calc() combined with custom properties (I've also seen it done by Ana Tudor and Temani Afif, among others). I wanted to try something like this too. Maybe create an example using a quadratic function. Then one thing led to another, and the demo started growing.
First, I built a basic graph of a cartesian system with a quadratic function with just HTML and CSS. All the values were hardcoded, so it was too specific. Then, I tried to make it more and more generic to match as many functions as possible: linear, quadratics, cubic, etc., and it worked. It scaled pretty well to the new operations. And it wasn't a complex demo either.
The Code
The whole code for the cartesian system fits in fewer than 40 lines of CSS code! And that's taking into account the use of CSS custom properties that made the whole thing a bit lengthy (but more customizable, so it's a give-and-take situation.)
Here is the CSS code:
.css-ccs { --c: 10; --cx: 5; --cy: 5; --dsize: 10; --dcolor: #369; --size: 100%; position: relative; width: var(--size); height: 0; padding-top: var(--size); box-sizing: border-box; aspect-ratio: 1/1; background-image: linear-gradient(#0000 calc(var(--cy) * 100% / var(--c) - 1px), #0008 0 calc(var(--cy) * 100% / var(--c) + 1px), transparent 0), linear-gradient(to right, #0000 calc(var(--cx) * 100% / var(--c) - 1px), #0008 0 calc(var(--cx) * 100% / var(--c) + 1px), transparent 0), repeating-linear-gradient(#0002 0 0.5px, #0000 0 calc(100% / var(--c) - 0.5px), #0002 0 calc(100% / var(--c))), repeating-linear-gradient(to right, #0002 0 0.5px, #0000 0 calc(100% / var(--c) - 0.5px), #0002 0 calc(100% / var(--c)));}.css-ccs.no-overflow { overflow: hidden;}.css-css .dot { --translationUnit: 100% / var(--c); --translationX: var(--translationUnit) * var(--cx); --translationY: var(--translationUnit) * var(--cy); /* Vertical is "flipped" in CSS: higher values go down! Do negative! */ --y: calc(var(--translationY) - var(--translationUnit) * var(--function)); width: calc(var(--dsize) * 1px); height: calc(var(--dsize) * 1px); background: var(--dcolor); border-radius: 50%; position: absolute; transform: translate(-50%, -50%); left: calc(var(--translationX) + var(--x) * var(--translationUnit)); top: var(--y);}That .css-ccs code will generate the axes and the guidelines, while the .dot sets the stage for the function later.
As for the HTML, we will need an element with class css-ccs (CSS Cartesian Coordinates System) that will contain other elements of class dot that will set the x value in the style. Something like this:
<div class="css-ccs"> <div class="dot" style="--x: -3;"></div> <div class="dot" style="--x: 0;"></div> <div class="dot" style="--x: 1;"></div> <div class="dot" style="--x: 2;"></div> <!-- ... --></div>Ideally, I would have loved to have something like this:
<figure> <figcaption>Graph Title</figcaption> <output data-x="-3"></output> <output data-x="0"></output> <output data-x="1"></output> <output data-x="2"></output></figure>And while I will eventually change the tags, not all of the changes are possible. data-x would be the best way for indicating the x value: a data attribute for a piece of data instead of a "styling variable." Unfortunately, CSS doesn't currently support reading the data attributes and passing the value to a custom property. So the custom property will do for now.
Finally, we need to plug in the function to the graph. It will go for the .dot class and be (kind of) straightforward: we will define a --function custom property in the dot with a calc() with the function. That's it.
The catch? CSS doesn't have powers (or many other types of operations for that matter), so to do something like x2, we will need to multiply x by x (x*x). We have x in the --x custom property, so we will need to do this:
.my-chart .dot { /** * x^2 = x * x = var(--x) * var(--x) */ --function: calc(var(--x) * var(--x));}A bit lengthy and verbose, but still simple and not too difficult to read.
Variables
We can customize the graph, passing some CSS variables to the chart itself (the container) and individually to each dot.
These are the variables for the container:
| Name | Default | Description |
|---|---|---|
--c | 10 | Number. Size of the diagram (in total "cells"). It must be a positive number. |
--cx | 5 | Number. Position of the x-axis in the diagram. It must be an integer. It should be positive and less or equal to --c. |
--cy | 5 | Number. Position of the y-axis in the diagram. It must be an integer. It should be positive and less or equal to --c. |
--dsize | 10 | Number. Size of the dots in pixels. It must be positive and greater than zero. |
--dcolor | #369 | Color. Color of the dots (any color format). |
--size | 100% | Length. Width of the coordinate system. It can be absolute or relative to the parent. |
Thanks to the CSS cascade, we can redefine some of those values individually for each dot. Additionally, we have to pass the x value for the dots:
| Name | Default | Description |
|---|---|---|
--dsize | 10 | Number. Size of the dots in pixels. It must be positive and greater than zero. |
--dcolor | #369 | Color. Color of the dots (any color format). |
--x | N/A | Number. Required. Value of the x to be passed to the function and represented in the graph. |
Examples and Demos
Here there are some examples of plotted graphs with CSS using this method:
Linear function: x - 3
#axis_x-3 .dot { /** * f(x) = x - 3 * x = var(--x) */ --function: calc(var(--x) - 3);}Quadratic function: x2 - 5
#axis_x2-5 .dot { /** * f(x) = x^2 - 5 * x^2 = var(--x) * var(--x) */ --function: calc(var(--x) * var(--x) - 5);}Cubic function: 0.4x3 - 5.25x - 4
#axis_04x3_525x_4 .dot { /** * f(x) = 0.4x^3 - 5.25x - 4 * 0.4x^3 = var(--x) * var(--x) * var(--x) * 5.25x = 5.25 * var(--x) */ --function: calc(0.4 * var(--x) * var(--x) * var(--x) - 5.25 * var(--x) - 4);}Reciprocal square function: 1 / x2
#axis_1_x2 .dot { /** * f(x) = 1 / x^2 * x^2 = var(--x) * var(--x) */ --function: calc(1 / (var(--x) * var(--x)));}Accessibility
The graphs may look nice, but they present some accessibility challenges. The whole chart is empty, so we should at least add an aria-label with a description of the content. Also, a role would be nice. Adding a role of "img" or "figure" would help announce the graph correctly to assistive technologies.
Even better, we could use the <figure>/<figcaption> tags. But then, we would need to do some CSS gymnastics because the background will take 100% of the container, and some overlap may happen.
As for the data points, right now, they are <div>, but more semantic tags would better describe what these elements are. (For example, <output>, <data>, or <samp>.)
<div class="css-ccs" role="img" aria-label="Cartesian coordinate system representing the function ... with points at ..."> <!-- ... --></div>Apart from that, the points don't have any information, and it would be nice to have some data on hover/focus. If/When we do that, we'll need to take into account the accessibility of both states, so there are good alternatives for assistive technology users.
What next
While the CSS works fine and it is a nice experiment, it lacks many key features. Some of them can be added or simulated with HTML and CSS, but others require JavaScript. Still, our little coordinates systems are lightweight and straightforward.
CSS's limitations also restrict the graphs. CSS math function list is growing (min, max, clamp, etc.), and we can simulate some common operations (as Ana Tudor shows in her articles, but there are still many math calculations that cannot be done just with CSS, and that will limit us.
Probably not something to keep building into a library, but it could be helpful for drawing small examples and doesn't require a heavy external library (I'll take 40 short lines of CSS vs. a 100KB bundle of JS). Plus it was fun to develop and figure out.
Original Link: https://dev.to/alvaromontoro/building-a-coordinate-system-in-css-and-html-pc7
Dev To
More About this Source Visit Dev To