
Some of Our Sources
- Engadget
- Simplebits
- Vandelay Design
- Naldz Graphics
- FanExtra - PSD
- Crazy Leaf Design
- Stylized Web
- Wal You
- Willems Lab
- The Verge
Help Webnuz
Referal links:
Monitoring your FastAPI application using OpenTelemetry
FastAPI is a modern Python web framework based on standard Python type hints that makes it easy to build APIs. It's a relatively new framework, having been released in 2018 but has now been adopted by big companies like Uber, Netflix, and Microsoft.
FastAPI is one of the fastest Python web frameworks currently available and is really efficient when it comes to writing code. It is based on ASGI specification, unlike other Python frameworks like Flask, which is based on WSGI specification.
Instrumentation is the biggest challenge engineering teams face when starting out with monitoring their application performance. OpenTelemetry is the leading open-source standard that is solving the problem of instrumentation. It is currently an incubating project under the Cloud Native Computing Foundation.
It is a set of tools, APIs, and SDKs used to instrument applications to create and manage telemetry data(Logs, metrics, and traces). It aims to make telemetry data(logs, metrics, and traces) a built-in feature of cloud-native software applications.
One of the biggest advantages of using OpenTelemetry is that it is vendor-agnostic. It can export data in multiple formats which you can send to a backend of your choice.
In this article, we will use SigNoz as a backend. SigNoz is an open-source APM tool that can be used for both metrics and distributed tracing.
Let's get started and see how to use OpenTelemetry for a FastAPI application.
Running a FastAPI application with OpenTelemetry
OpenTelemetry is a great choice to instrument ASGI frameworks. As it is open-source and vendor-agnostic, the data can be sent to any backend of your choice.
Installing SigNoz
You can get started with SigNoz using just three commands at your terminal if you have Docker installed. You can install Docker from its official website.
git clone https://github.com/SigNoz/signoz.gitcd signoz/deploy/./install.shThe install.sh script will install SigNoz for you. Trying out SigNoz with ClickHouse database takes less than 1.5GB of memory.

When you are done installing SigNoz, you can access the UI at:http://localhost:3000
The application list shown in the dashboard is from a sample app called HOT R.O.D that comes bundled with the SigNoz installation package.
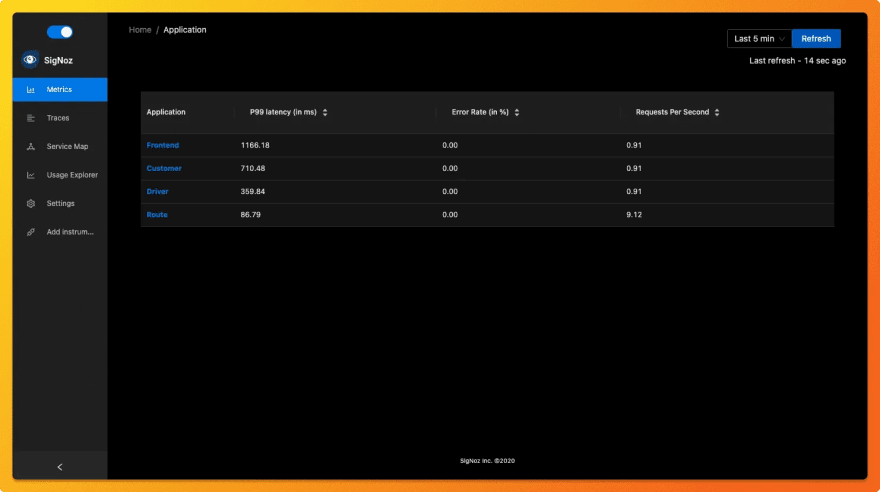 List of applications shown as an example on SigNoz dashboard
Instrumenting a sample FastAPI application with OpenTelemetry
Prerequisites
Python 3.6 or newer
Download the latest version of Python.
Running sample FastAPI app
We will be using the FastAPI app at this Github repo. All the required OpenTelemetry packages are contained within the requirements.txt file under app folder in this sample app.
git clone https://github.com/sureshdsk/sample-fastapi-app.gitcd sample-fastapi-app/Run with docker
Build docker image
docker build -t sample-fastapi-app .You need to set some environment variables while running the application with OpenTelemetry and send collected data to SigNoz. You can do so with the following commands at the terminal:
# If you have your SigNoz IP Address, replace <IP of SigNoz> with your IP Address. docker run -d --name fastapi-container \-e OTEL_METRICS_EXPORTER='none' \-e OTEL_RESOURCE_ATTRIBUTES='service.name=fastapiApp' \-e OTEL_EXPORTER_OTLP_ENDPOINT='http://<IP of SigNoz>:4317' \-p 5000:5000 sample-fastapi-appIf you're using docker-compose setup:
# If you are running signoz through official docker-compose setup, run `docker network ls` and find clickhouse network id. It will be something like this clickhouse-setup_default # and pass network id by using --net <network ID>docker run -d --name fastapi-container \ --net clickhouse-setup_default \ --link clickhouse-setup_otel-collector_1 \-e OTEL_METRICS_EXPORTER='none' \-e OTEL_RESOURCE_ATTRIBUTES='service.name=fastapiApp' \-e OTEL_EXPORTER_OTLP_ENDPOINT='http://clickhouse-setup_otel-collector_1:4317' \-p 5000:5000 sample-fastapi-appIf you're running SigNoz in your local host then you can replace <IP of SigNoz> with localhost and the final command will look like below:
docker run -d --name fastapi-container \-e OTEL_METRICS_EXPORTER='none' \-e OTEL_RESOURCE_ATTRIBUTES='service.name=fastapiApp' \-e OTEL_EXPORTER_OTLP_ENDPOINT='http://localhost:4317' \-p 5000:5000 sample-fastapi-appYou need to generate some load on your app so that there is data to be captured by OpenTelemetry. You can use locust for this load testing.
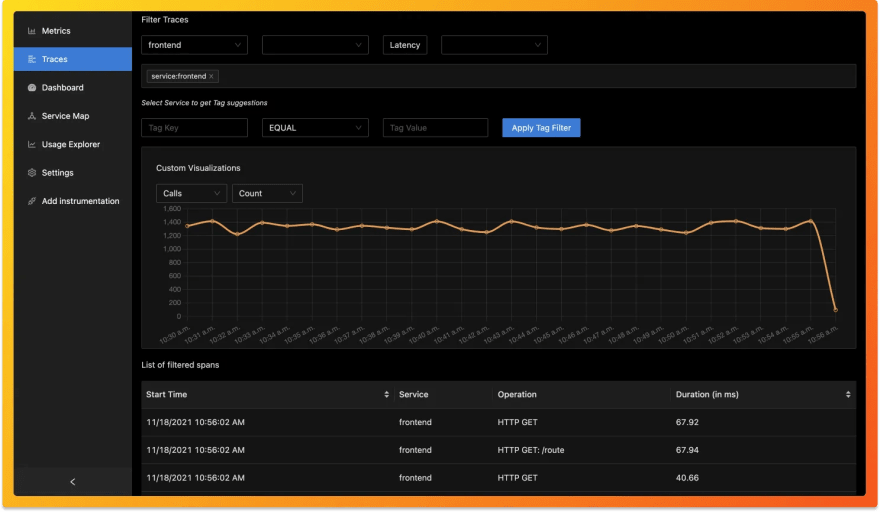
pip install locustlocust -f locust.py --headless --users 10 --spawn-rate 1 -H http://localhost:5000You will find fastapiAPP in the list of sample applications being monitored by SigNoz.
 FastAPI in the list of applications being monitored by SigNoz
Open-source tool to visualize telemetry data
SigNoz makes it easy to visualize metrics and traces captured through OpenTelemetry instrumentation.
SigNoz comes with out of box RED metrics charts and visualization. RED metrics stands for:
- Rate of requests
- Error rate of requests
- Duration taken by requests
 Measure things like application latency, requests per sec, error percentage and see your top endpoints with SigNoz.
You can then choose a particular timestamp where latency is high to drill down to traces around that timestamp.
 View of traces at a particular timestamp
You can use flamegraphs to exactly identify the issue causing the latency.
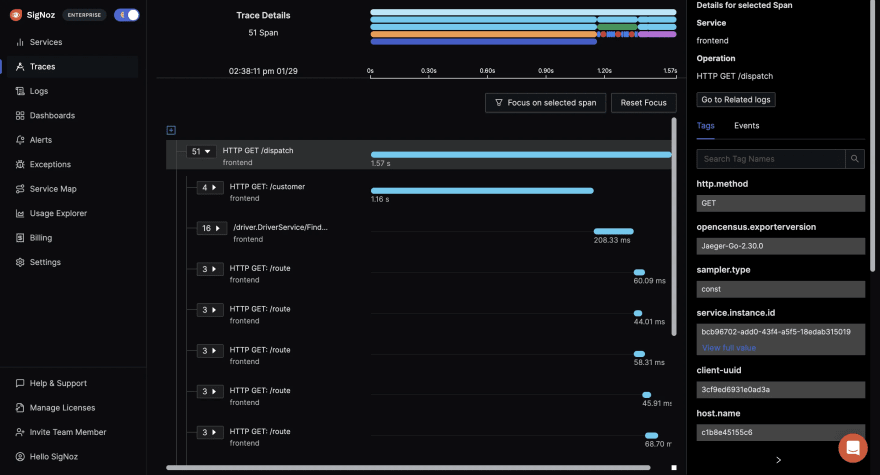 View of traces at a particular timestamp
You can also build custom metrics dashboard for your infrastructure.
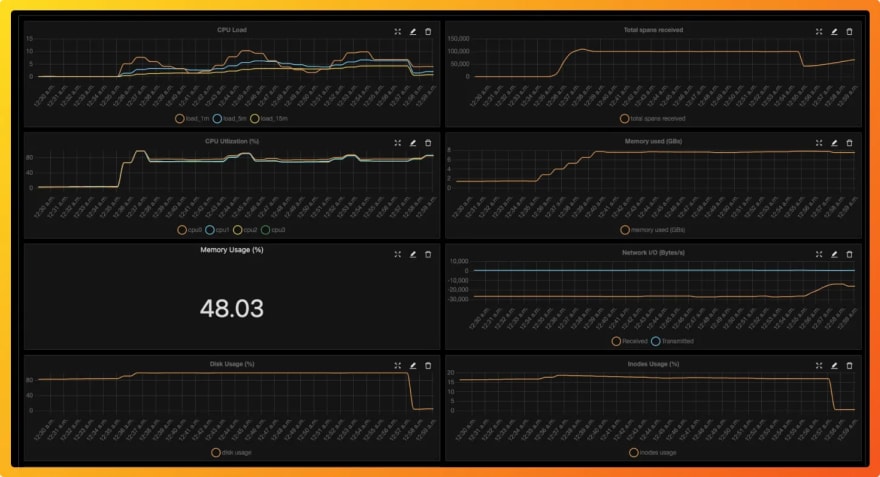 You can also build a custom metrics dashboard for your infrastructure
Conclusion
OpenTelemetry makes it very convenient to instrument your FastAPI application. You can then use an open-source APM tool like SigNoz to analyze the performance of your app. As SigNoz offers a full-stack observability tool, you don't have to use multiple tools for your monitoring needs.
You can try out SigNoz by visiting its GitHub repo
If you have any questions or need any help in setting things up, join our slack community and ping us in #help channel.

Read more about OpenTelemetry
Things you need to know about OpenTelemetry tracing
OpenTelemetry collector - architecture and configuration guide
Original Link: https://dev.to/signoz/monitoring-your-fastapi-application-using-opentelemetry-40p1
Dev To
More About this Source Visit Dev To