
An Interest In:
Web News this Week
- April 25, 2024
- April 24, 2024
- April 23, 2024
- April 22, 2024
- April 21, 2024
- April 20, 2024
- April 19, 2024
Some of Our Sources
- Mashable
- Simplebits
- Spoon Graphics
- You The Designer
- FanExtra - PSD
- My Ink Blog
- Web Design Ledger
- Line 25
- Web Resource Source
- Codrops
Help Webnuz
Referal links:
November 22, 2021 08:13 pm GMT
Original Link: https://dev.to/muckitymuck/prometheus-and-grafana-part-2-47bg
Prometheus and Grafana, Part 2
The Prometheus.yml:
# my global configglobal: scrape_interval: 15s # Set the scrape interval to every 15 seconds. Default is every 1 minute. evaluation_interval: 15s # Evaluate rules every 15 seconds. The default is every 1 minute.scrape_configs: # The job name is added as a label `job=<job_name>` to any timeseries scraped from this config. - job_name: 'prometheus' # metrics_path defaults to '/metrics' # scheme defaults to 'http'. static_configs: - targets: ['localhost:9090'] - job_name: 'node-exporter' # Override the global default and scrape targets from this job every 5 seconds. scrape_interval: 5s metrics_path: /metrics static_configs: - targets: - <PUBLIC IP>:9100This is a good starting place for a monitoring system for Linux boxes
Running the services in docker is also advised as it simplifies the rollout.
Docker node exporter:
sudo docker run --restart always -d --net="host" --pid="host" -v "/:/host:ro,rslave" prom/node-exporter:latest --path.rootfs=/hostDocker prometheus:
sudo docker service create --replicas 1 --name dockerprometheus --mount type=bind,source=/home/ubuntu/prometheus/prometheus.yml,destination=/etc/prometheus/prometheus.yml --publish published=9090,target=9090,protocol=tcp prom/prometheusWhen you get around to making panels in Grafana, these queries are very useful:
100 - ((node_filesystem_avail_bytes{mountpoint="/",fstype!="rootfs"} * 100) / node_filesystem_size_bytes{mountpoint="/",fstype!="rootfs"})node_filesystem_avail_bytesOR you could just setup a template for Node Exporter:
To import a new dashboard for Node Exporter, go to Dashboards -> Manage
Enter 405 for the Grafana ID.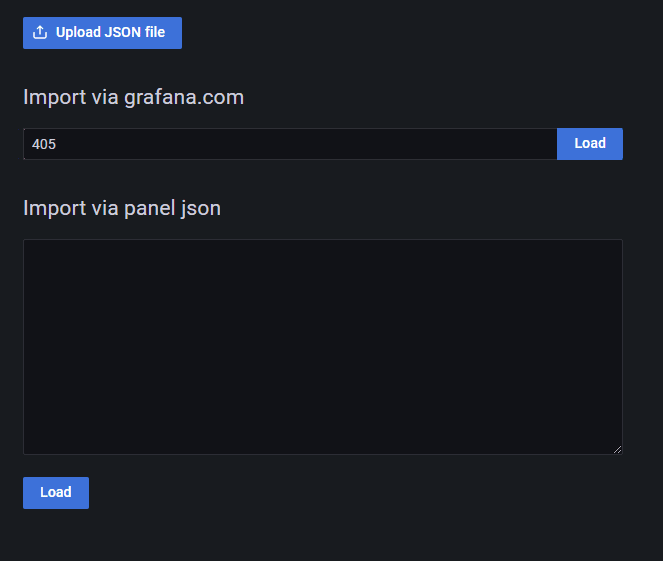
Pick up the name and choose a Data Source for the dashboard.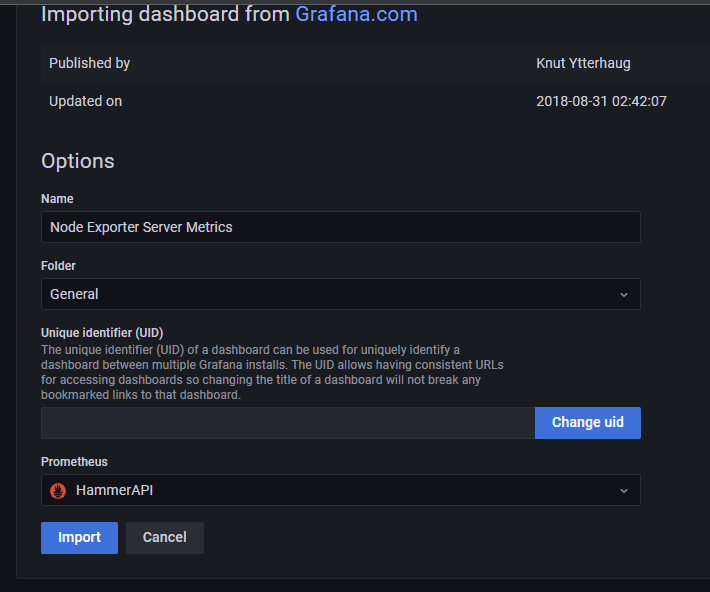
To make an alert, start a NEW dashboard and NEW panel. Template dashboards like above will not work.
Enter the query for the item you want to track and press the Alert tab.
That should do it for a basic monitoring service.
Original Link: https://dev.to/muckitymuck/prometheus-and-grafana-part-2-47bg
Share this article:
Tweet

View Full Article
Dev To
More About this Source Visit Dev To