
An Interest In:
Web News this Week
- March 20, 2024
- March 19, 2024
- March 18, 2024
- March 17, 2024
- March 16, 2024
- March 15, 2024
- March 14, 2024
Some of Our Sources
- Spoon Graphics
- Smashing Magazine
- You The Designer
- Fuel Your Creativity
- Inspiredology
- Naldz Graphics
- Reencoded
- Spyre Studios
- Android Dissected
- Codrops
Help Webnuz
Referal links:
Monitoring your Flask application using OpenTelemetry
In this article, we will use OpenTelemetry to instrument a sample Flask app. Flask is one of the most popular web application frameworks of Python. It consists of Werkzeug WSGI toolkit and Jinja2 template engine.
Instrumentation is one of the biggest challenge engineering teams face when starting out with observability. Instrumenting a distributed application architecture is not easy. Applications now have distributed services as well as distributed teams that might be using multiple programming languages and numerous frameworks and libraries.
OpenTelemetry is the leading open-source standard that is solving the problem of instrumentation. It is currently an incubating project under the Cloud Native Computing Foundation.
It is a set of tools, APIs, and SDKs used to instrument applications to create and manage telemetry data(Logs, metrics, and traces). It aims to make telemetry data(logs, metrics, and traces) a built-in feature of cloud-native software applications.
Why use OpenTelemetry?
As might be clear by now that OpenTelemetry helps you to generate telemetry data. You still need a backend to analyze, store and visualize that data. By design, OpenTelemetry is vendor-agnostic. And that's one of the biggest advantages of using OpenTelemetry. It can export data in multiple formats which you can send to a backend of your choice.
In this article, we will use SigNoz as a backend. SigNoz is an open-source APM that can be used for both metrics and distributed tracing.
Let's get started and see how to use OpenTelemetry for a Flask application.
Running a Flask application with OpenTelemetry
OpenTelemetry is a set of tools, APIs, and SDKs used to instrument applications to create and manage telemetry data(logs, metrics, and traces).
Installing SigNoz
You can get started with SigNoz using just three commands at your terminal if you have Docker installed. You can install Docker from itsofficial website.
git clone https://github.com/SigNoz/signoz.gitcd signoz/deploy/./install.shYou will have an option to choose between ClickHouse or Kafka + Druid as a storage option. Trying out SigNoz with ClickHouse database takes less than 1.5GB of memory, and for this tutorial, we will use that option.

When you are done installing SigNoz, you can access the UI at:http://localhost:3000
The application list shown in the dashboard is from a sample app called HOT R.O.D that comes bundled with the SigNoz installation package.
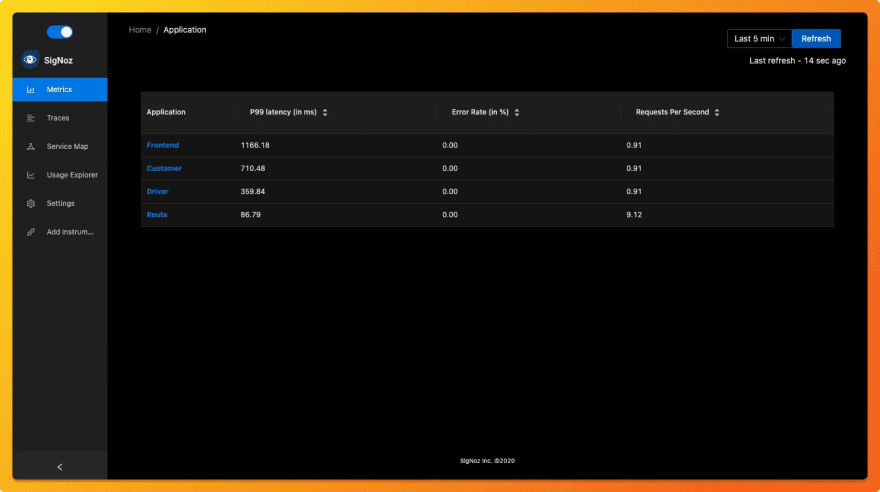 SigNoz Dashboard
Getting a sample Flask application
Prerequisites
Python 3.4 or newer
Download the latest version of Python.MongoDB
Below are the download links for different OS:
MacOS
Linux
Windows
Running sample Flask app
We will be using the Flask app at this Github repo.
Clone sample Flask app repository and go to the root folder
git clone https://github.com/SigNoz/sample-flask-app.git cd sample-flask-appCheck if the app is running
python3 app.pyYou can now access the UI of the app on your local host: http://localhost:5000/
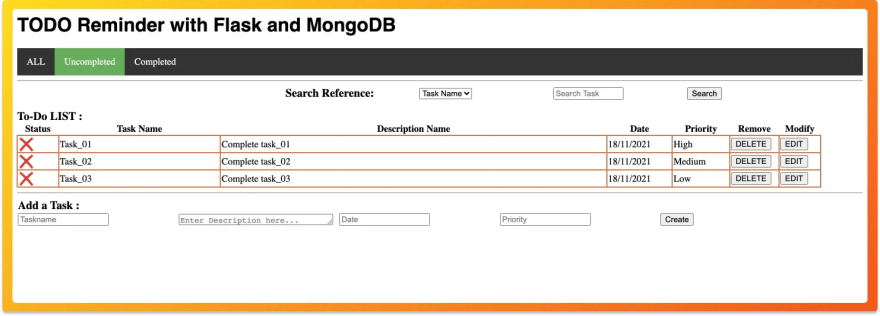 Sample flask application running on local host
Instrumenting the Flask application with OpenTelemetry
Opentelemetry Python instrumentation installation
The app folder contains a file called requirements.txt, which contains all the necessary requirements to set up OpenTelemetry Python instrumentation. Make sure your path is updated to the root directory of your sample app and run the following command:
pip3 install -r requirements.txtIf it hangs while installinggrpcioduringpip3 install opentelemetry-exporter-otlpthen follow below steps as suggested inthis stackoverflow link.
- pip3 install --upgrade pip
- python3 -m pip install --upgrade setuptools
- pip3 install --no-cache-dir --force-reinstall -Iv grpcio
Install application-specific packages
This step is required to install packages specific to the application. Make sure to run this command in the root directory of your installed application. This command figures out which instrumentation packages the user might want to install and installs it for them:
opentelemetry-bootstrap --action=installPassing the necessary environment variables
You're almost done. In the last step, you just need to configure a few environment variables for your OTLP exporters. Environment variables that need to be configured:
- SERVICE_NAME- application service name (you can name it as you like)
- ENDPOINT_ADDRESS - OTLP gRPC collector endpoint address (IP of SigNoz)After taking care of these environment variables, you only need to run your instrumented application. Accomplish all these by using the following command at your terminal.
OTEL_RESOURCE_ATTRIBUTES=service.name=flaskApp OTEL_METRICS_EXPORTER=none OTEL_EXPORTER_OTLP_ENDPOINT="http://<IP of SigNoz>:4317" opentelemetry-instrument python3 app.pyIp of SigNozcan be replaced with localhost in this case. Hence, the final command becomes:
OTEL_RESOURCE_ATTRIBUTES=service.name=flaskApp OTEL_METRICS_EXPORTER=none OTEL_EXPORTER_OTLP_ENDPOINT="http://localhost:4317" opentelemetry-instrument python3 app.pyAnd congratulations! You have now instrumented your flask application with OpenTelemetry.
Below you can find yourFlask_app in the list of applications being monitored on SigNoz dashboard.
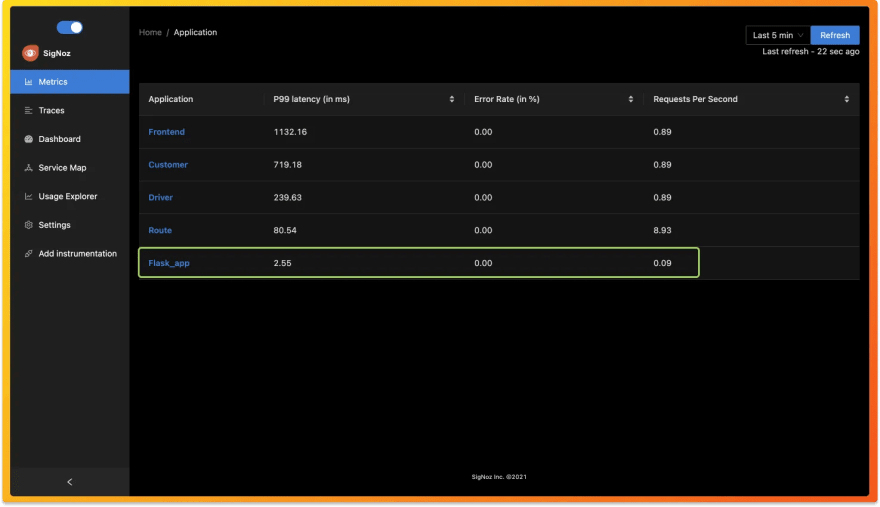 Flask app in the list of applications monitored by SigNoz
Open-source tool to visualize telemetry data
SigNoz makes it easy to visualize metrics and traces captured through OpenTelemetry instrumentation.
SigNoz comes with out of box RED metrics charts and visualization. RED metrics stands for:
- Rate of requests
- Error rate of requests
- Duration taken by requests
 Measure things like application latency, requests per sec, error percentage and see your top endpoints with SigNoz.
You can then choose a particular timestamp where latency is high to drill down to traces around that timestamp.
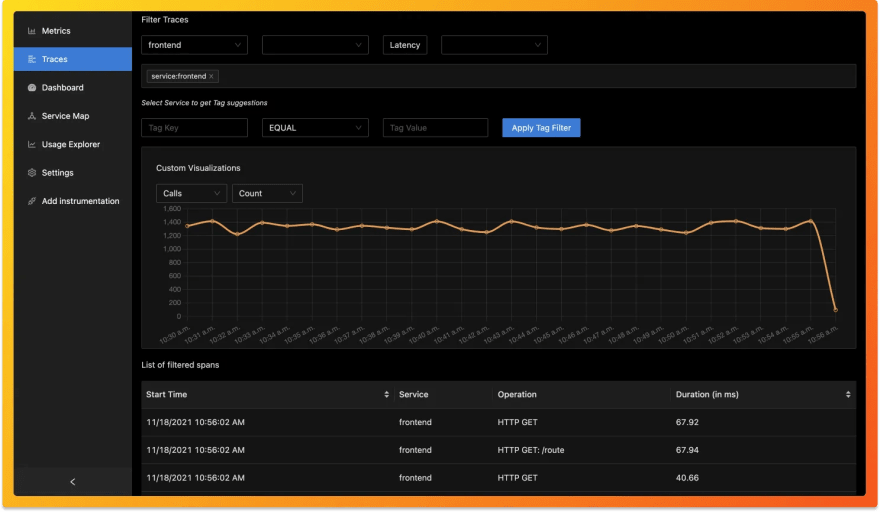 View of traces at a particular timestamp
You can use flamegraphs to exactly identify the issue causing the latency.
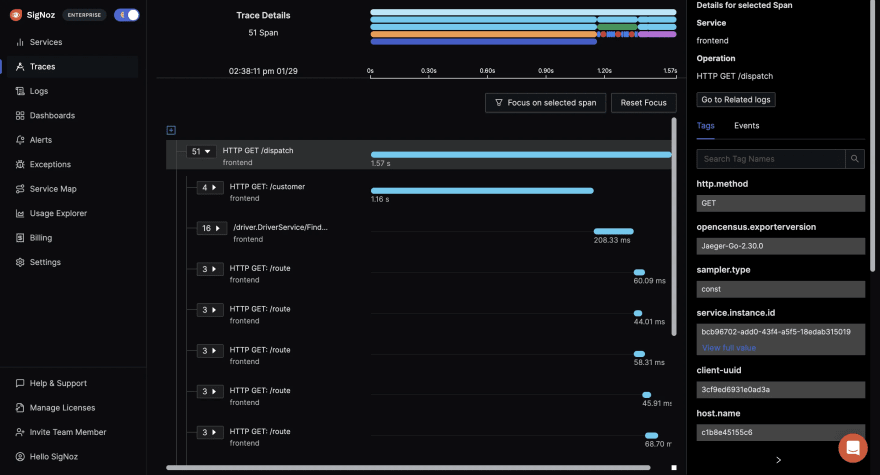 View of traces at a particular timestamp
You can also build custom metrics dashboard for your infrastructure.
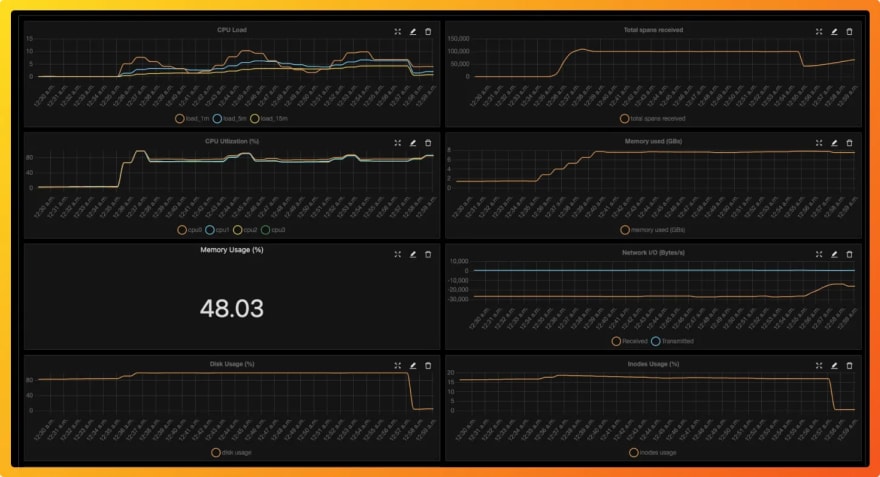 You can also build a custom metrics dashboard for your infrastructure
Conclusion
OpenTelemetry makes it very convenient to instrument your Flask application. You can then use an open-source APM tool like SigNoz to analyze the performance of your app. As SigNoz offers a full-stack observability tool, you don't have to use multiple tools for your monitoring needs.
You can try out SigNoz by visiting its GitHub repo
If you have any questions or need any help in setting things up, join our slack community and ping us in #help channel.

If you want to read more about SigNoz
Original Link: https://dev.to/signoz/monitoring-your-flask-application-using-opentelemetry-2l2o
Dev To
More About this Source Visit Dev To