
An Interest In:
Web News this Week
- April 19, 2024
- April 18, 2024
- April 17, 2024
- April 16, 2024
- April 15, 2024
- April 14, 2024
- April 13, 2024
Some of Our Sources
- Smashing Magazine
- Smashing Apps
- TutsPlus - Design
- Vandelay Design
- Web Designer Depot
- Crazy Leaf Design
- Stylized Web
- Wal You
- Spyre Studios
- Design Modo
Help Webnuz
Referal links:
Google Trends with Python
Thinking these days how we probably started to value more building blocks of our existence. As it started to feel more integrated into our existence as follows - health, water, food and often mentioned Covid that limited our ability to travel for some regions. To have overall knowledge of how does it goes worldwide there is well known Google Trends online tool to work with. But there is something special for those who are in love with Python. Beautiful graphing library Plotly licensed under the MIT license.
Scripts to download
Here is a simple installation prepared to work with on my GitHub repository with a requirements.txt file and a short script to plot data into a nice histogram data form. Simply download these two files as follows so save to your desktop into some working directory google-trends-analysis.py and requirements.txt Create a directory named google-trends-analysis and save these files into.
Activate Virtualenv
I do assume you already have virtualenv installed, but if not just execute sudo pip3 install virtualenv. Enter into google-trends-analysis directory with cd google-trends-analysis.
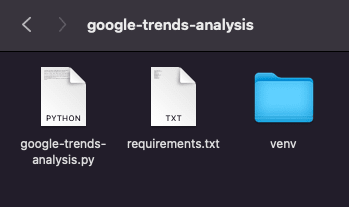
cd google-trends-analysisTo make all stuff properly done activate virtualenv with the creation of working virtual environment directory called venv.
virtualenv venv Your google-trends-analysis directory looks like now like on picture hereunder.
Now activate this working environment.
source venv/bin/activatePytrends and Plotly Libraries to Install
All libraries needed to run Google Trends and Plotly correctly are saved in requirements.txt file. Now execute installation in a virtual environment we already activated.
pip3 install -r requirements.txtThis will take a while to pass all installations. You'll see in your terminal how all libraries are installed to properly run the script.
After installation to run google-trends-analysis.py script hereunder just type this command and enjoy response in your browser IP 127.0.0.1 on a random port.
python3 google-trends-analysis.pyThis is how it will look like, a nicely plotted graph in the final result.


Thanks to Edward Howell for the cover image from Unsplash.
Original Link: https://dev.to/stankukucka/google-trends-with-python-5fh7
Dev To
More About this Source Visit Dev To