An Interest In:
Web News this Week
- April 16, 2024
- April 15, 2024
- April 14, 2024
- April 13, 2024
- April 12, 2024
- April 11, 2024
- April 10, 2024
Edge DevTools for Visual Studio Code 1.4.0 - Improved Screencasting, Device Emulation and live, inline issue reporting
The 1.4.0 release of the Microsoft Tools for Visual Studio Code brings a few highly requested features. We improved the screencasting feature, added device emulation and live issue reporting in your source code. You can check the 3 minute highlight reel here.
Improved screencasting
In previous versions of the extension, the screencast was a rudimentary feature tied to the panel of the extension. This didn't give you much space to play with and the interactivity was limited. In this version, we moved the screencast to an own tab, which means that you can move it anywhere you want in your Visual Studio Code and use split panels. Furthermore, the screencast now supports developer tools overlays, which means you can see the padding and margin when navigating the HTML source and the inspector overlays.
Device emulation
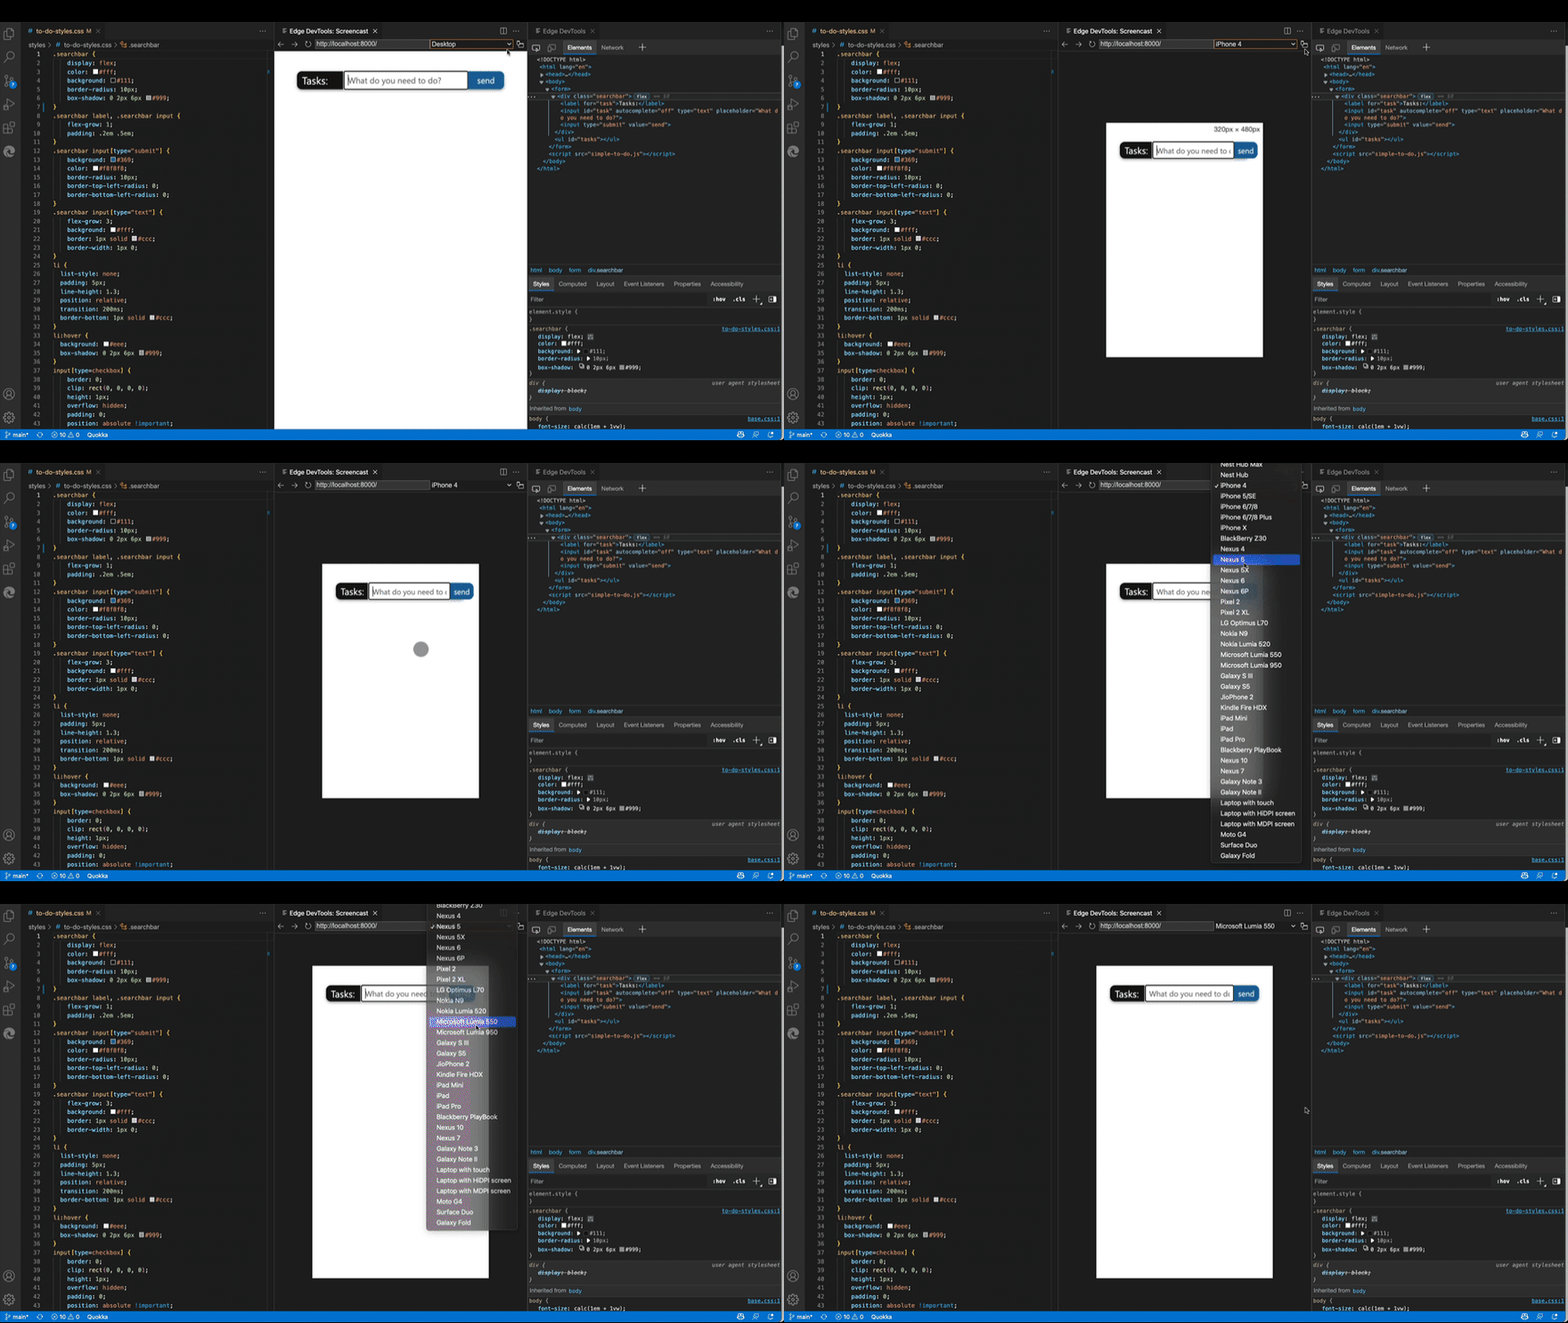
One of the most requested features of the screencast was device emulation. People wanted to simulate different mobile devices without having to switch to the browser. Right next to the location field of the screencast you can now find a dropdown with a pre-populated list of mobile devices. You can select any of them and the viewport of the screencast will get resized accordingly. If the device is a touch device, you also get touch emulation, as indicated by the cursor changing to a filled circle. Next to the dropdown you also get a button to switch the device orientation.
Live inline issue reporting
The issues panel in browser developer tools shows you problems with accessibility, interoperability, performance and security. We considered moving this one to the extension, but thought we can do better. If your source code now has an issue, you will see a red underline under the line of code. You can hover over the line and you get information what the problem is, how to fix it and links to more documentation. You can also navigate all the issues in the current document or use the problems tab in the lower panel to see all issues in the current workspace.
Get the extension
The extension is available for all major platforms from inside Visual Studio Code and on the marketplace. The source is also available on GitHub and we invite anyone to file issues you encounter. Some of the functionality is dependent on you having an installation of Microsoft Edge Canary (version 96) and you need to have Node/NPM installed on your machine.
Original Link: https://dev.to/codepo8/edge-devtools-for-visual-studio-code-140-improved-screencasting-device-emulation-and-live-inline-issue-reporting-1hh
Dev To
 An online community for sharing and discovering great ideas, having debates, and making friends
More About this Source Visit Dev To


