
An Interest In:
Web News this Week
- March 26, 2024
- March 25, 2024
- March 24, 2024
- March 23, 2024
- March 22, 2024
- March 21, 2024
- March 20, 2024
Some of Our Sources
- Techcrunch
- Simplebits
- Web Designer Wall
- The Logo Smith
- Smashing Magazine
- Vandelay Design
- Fuel Your Creativity
- Stylized Web
- Wal You
- Design Modo
Help Webnuz
Referal links:
AWS X-Ray vs Jaeger - key features, differences and alternatives
Both AWS X-Ray and Jaeger are distributed tracing tools used for performance monitoring in a microservices architecture. Jaeger was originally built by teams at Uber and then open-sourced in 2015. On the other hand, AWS X-Ray is a distributed tracing tool provided by AWS specifically focused on distributed tracing for applications using Amazon Cloud Services.
Jaeger is a popular open-source tool that graduated as a project from Cloud Native Computing Foundation. On the other hand, Amazon X-Ray is more suited to an application built on Amazon Cloud Services.
But before we dive into the details of Amazon X-Ray and Jaeger, let's take a short detour to understand distributed tracing.
What is distributed tracing?
In the world of microservices, a user request travels through hundreds of services before serving a user what they need. To make a business scalable, engineering teams are responsible for particular services with no insight into how the system performs as a whole. And that's where distributed tracing comes into the picture.
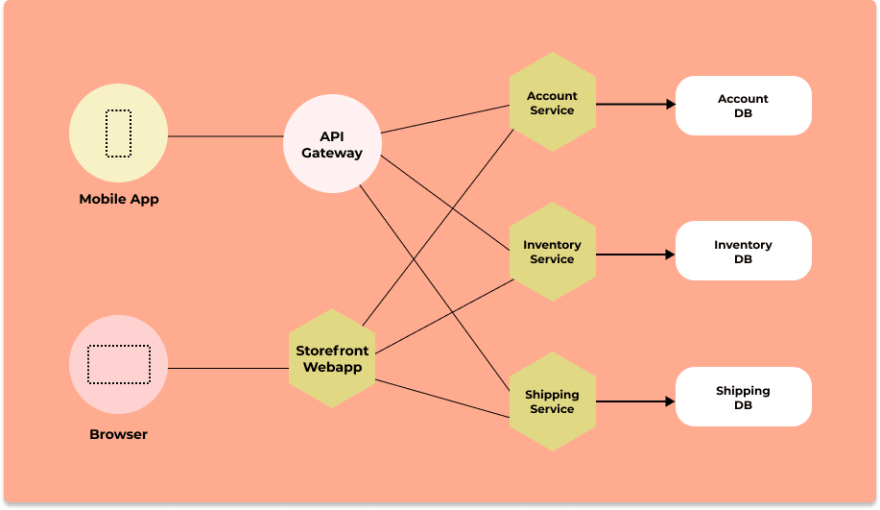 Microservice architecture of a fictional e-commerce application
Distributed tracing gives you insight into how a particular service is performing as part of the whole in a distributed software system. There are two essential concepts involved in distributed tracing: Spans and trace context.
User requests are broken down into spans.
What are spans?
Spans represent a single operation within a trace. Thus, it represents work done by a single service which can be broken down further depending on the use case.
A trace context is passed along when requests travel between services, which tracks a user request across services. Thus, you can see how a user request performs across services and identify what exactly needs your attention without manually shifting through multiple dashboards.
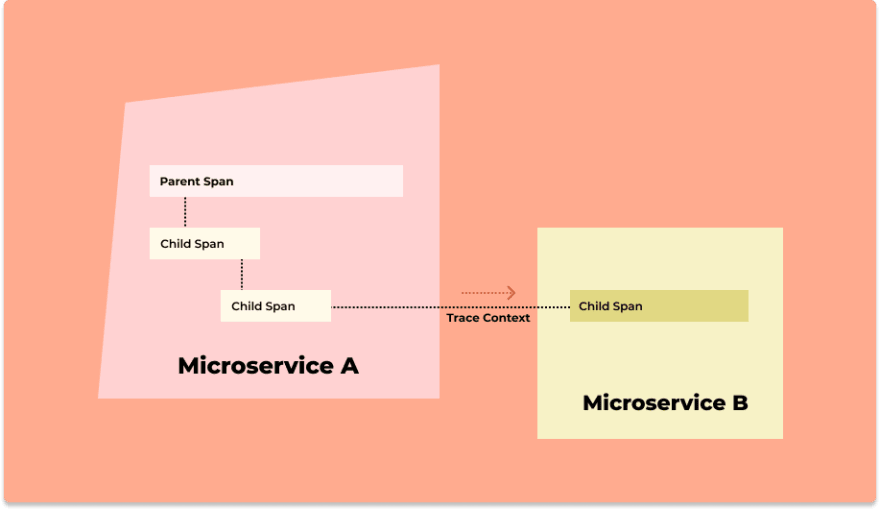 A trace context is passed when user requests pass from one service to another
Key Features of AWS X-Ray
AWS X-Ray helps developers to analyze and debug distributed applications in production. Using AWS X-Ray, you can identify the root cause of performance issues and errors. Some of the key features of AWS X-Ray includes:
End-to-end tracing
AWS X-Ray gathers data from individual services and gives you a cross-service view of requests made to your application. It aggregates request data into a single trace, which can then be used to follow the path of an individual request as it passes through different services.Service Map
Service Maps give you an overview of how your services are connected in the application architecture. Service Maps can be used to identify latency issues in the services of your application at a glance.Server and Client side latency detection
Using AWS X-Ray, you can detect node and edge latency distribution directly from the service map. With filters based on custom annotations, you can quickly drill down to issues impacting your end-user experience.Data annotation and filtering
You can add business-specific metadata to your traces. Data annotation enables rich context for your trace data which can further be utilized for advanced trace filtering.Role based access control
A large distributed application will have lots of sensitive telemetry data. AWS X-Ray gives you the flexibility to control which users and resources have permission to access your traces and how.
 Service Maps feature on AWS X-Ray
 User request tracking using traces on AWS X-Ray dashboard
Key features of Jaeger
Jaeger was originally built by teams at Uber and then open-sourced. It is used for end-to-end distributed tracing for microservices. Some of the key features of Jaeger includes:
Distributed context propagation
One of the challenges of distributed systems is to have a standard format for passing context across process boundaries and services. Jaeger provides client libraries that support code instrumentation in multiple languages to propagate context across servicesDistributed transaction monitoring
Jaeger comes with a web UI written in Javascript. The dashboard can be used to see traces and spans across services.Root Cause Analysis
Using traces you can drill down to services causing latency in particular user request.Server dependency analysis
Using Jaeger's web UI, you can see how requests flow through different services and different servers interact while serving user requests.Performance/latency optimization
Once you have identified, which service or query is creating latency, you can use the information to optimize it.
 Jaeger UI showing services and corresponding traces
Comparing AWS X-Ray and Jaeger
The most important difference between AWS X-Ray and Jaeger is that AWS X-Ray only supports tracing for applications in the AWS cloud ecosystem while Jaeger, an open-source tool, provides a vendor-agnostic way to collect and analyze trace data.
Some of the key differences between AWS X-Ray and Jaeger are:
AWS X-Ray can only be used with applications running on Amazon EC2, Amazon EC2 container service, AWS Lambda, and AWS Elastic Beanstalk. On the other hand, Jaeger is an open-source tool under CNCF that can generate and manage trace data on any cloud vendor.
Jaeger's instrumentation libraries used to generate trace data are based on OpenTracing standards - vendor-neutral APIs and instrumentation for distributed tracing. Open-source instrumentation libraries are better suited for distributed and polyglot architectures. AWS X-Ray offers X-Ray SDK and X-Ray agent to instrument code.
AWS X-Ray supports only a handful of databases to be monitored. The X-Ray SDK can capture metadata for requests made to My SQL, PostgreSQL, and Amazon Dynamo databases. Whereas Jaeger can track requests to most databases as it is based on OpenTracing APIs.
Jaeger has broad community support. Its GitHub repo has almost 14k stars, and its community is backed up by members from all major cloud vendors like Microsoft and Google. On the other hand, AWS X-Ray is a proprietary tool by Amazon and does not have an open community around it.
AWS X-Ray is a paid tool including an option of 100k traces to be recorded free on the AWS free tier. It is managed service by AWS, which can be used by customers building on AWS. Jaeger, on the other hand, is completely open-source and free. That also means you are responsible for setting up and maintain your distributed tracing stack with Jaeger.
AWS X-Ray is perfect for users who are building only on the AWS cloud ecosystem. But with distributed teams and multi-language tech architecture, you might use different cloud vendors and pieces outside the AWS ecosystem. So it makes more sense to use an open-source solution for setting up distributed tracing.
This makes Jaeger a better alternative for end-to-end distributed tracing. But Jaeger is limited to distributed tracing, and engineering teams need more than just traces for a robust performance monitoring system.
That's where SigNoz comes into the picture. It provides a full-stack open-source performance monitoring platform.
Alternative to AWS X-Ray and Jaeger - SigNoz
SigNoz is a full-stack open-source application performance monitoring and observability tool which can be used in place of AWS X-Ray and Jaeger. It provides advanced distributed tracing capabilities along with metrics under a single dashboard.
SigNoz is built to support OpenTelemetry natively. OpenTelemetry is becoming the world standard for generating and managing telemetry data (Logs, metrics, and traces). It also provides users flexibility in terms of storage. You can choose between ClickHouse or Kafka + Druid as your backend storage while installing SigNoz.
 Architecture of SigNoz with ClickHouse as storage backend and OpenTelemetry for code instrumentatiion
SigNoz comes with out of box visualization of things like RED metrics.
 SigNoz UI showing application overview metrics like RPS, 50th/90th/99th Percentile latencies, and Error Rate
You can also use flamegraphs to visualize spans from your trace data. All of this comes out of the box with SigNoz.
 Flamegraphs showing exact duration taken by each spans - a concept of distributed tracing
Some of the things SigNoz can help you track:
- Application overview metrics like RPS, 50th/90th/99th Percentile latencies, and Error Rate
- Slowest endpoints in your application
- See exact request trace to figure out issues in downstream services, slow DB queries, call to 3rd party services like payment gateways, etc
- Filter traces by service name, operation, latency, error, tags/annotations.
- Run aggregates on trace data
- Unified UI for both metrics and traces
You can check out SigNoz's GitHub repo here
Original Link: https://dev.to/signoz/aws-x-ray-vs-jaeger-key-features-differences-and-alternatives-322
Dev To
More About this Source Visit Dev To