
An Interest In:
Web News this Week
- April 24, 2024
- April 23, 2024
- April 22, 2024
- April 21, 2024
- April 20, 2024
- April 19, 2024
- April 18, 2024
Some of Our Sources
- Mashable
- Techcrunch
- Web Designer Wall
- The Logo Smith
- Smashing Apps
- Creative Curio
- Fudge Graphics
- Android Dissected
- Willems Lab
- The Verge
Help Webnuz
Referal links:
showdev: Serverless IoT Dashboard
I want to showdev how I built a serverless IoT (internet-of-things) dashboard for a Tasmota / BME680 air quality sensor.
Preview of the real-time dashboard:
The hardware: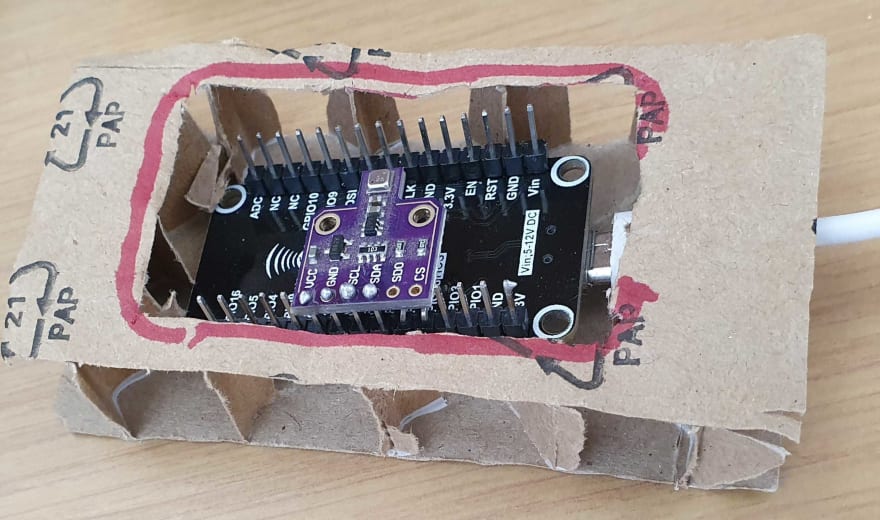
(I made the case out of corrugated cardboard I had lying around, and sealed it up with a few more sheets of cardboard glued together. I did leave vents so that it can detect the actual air too)
The architecture: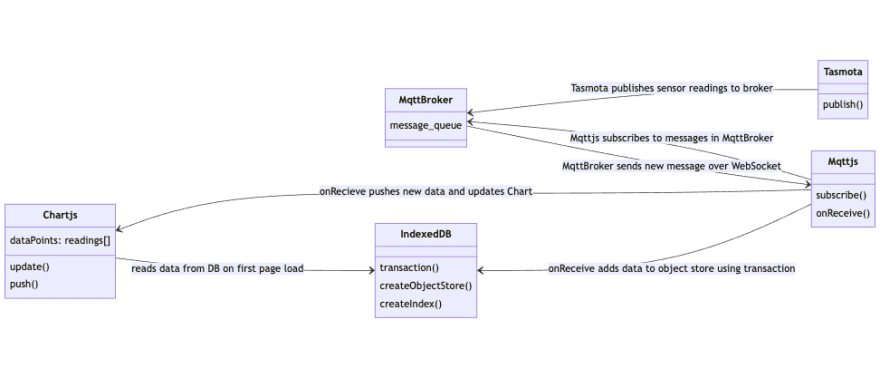
The data is collected using Tasmota on an ESP8266. I soldered a BME680 directly to the ESP8266 pins and mapped the pins accordingly using the web config. I configured Tasmota to send the data to a free public MQTT broker provided by emqx. It would be ok to self host broker, but that wouldn't be as serverless. The Tasmota/ESP8266 is connected to my home wifi, and since it's only sending messages out, no special NAT changes or Port Forwarding was required.
The serverless static site architecture is based on MQTT.js reading from an MQTT broker, and displaying the data using Chart.js with chartjs-plugin-streaming for real-time chart updates.
I decided to use vanilla javascript DOM updates to keep it simple. The static site stores the messages within the browser for historical purposes, and to enable the first load to happen with live data. Static site hosting and CI/CD is done through Github (Pages and Actions).
![]()
MQTT.js is a client library for the MQTT protocol, writtenin JavaScript for node.js and the browser.
- Upgrade notes
- Installation
- Example
- Command Line Tools
- API
- Browser
- Weapp
- About QoS
- TypeScript
- Contributing
- License
MQTT.js is an OPEN Open Source Project, see the Contributing section to find out what this means.
Important notes for existing users
v4.0.0 (Released 04/2020) removes support for all end of life node versions, and now supports node v12 and v14. It also adds improvements todebug logging, along with some feature additions.
As a breaking change, by default a error handler is built into the MQTT.js client, so if anyerrors are emitted and the user has not created an event handler on the client for errors, the client willnot break as a result of unhandled errors. Additionally, typical TLS errors like ECONNREFUSED, ECONNRESET have beenadded to a list of TLS errors that
Simple yet flexible JavaScript charting for designers & developers
Documentation
All the links point to the new version 3 of the lib.
In case you are looking for the docs of version 2, you will have to specify the specific version in the url like this: https://www.chartjs.org/docs/2.9.4/
Contributing
Instructions on building and testing Chart.js can be found in the documentation. Before submitting an issue or a pull request, please take a moment to look over the contributing guidelines first. For support, please post questions on Stack Overflow with the chartjs tag.
License
Chart.js is available under the MIT license.
 nagix / chartjs-plugin-streaming
Chart.js plugin for live streaming data
![]()
chartjs-plugin-streaming
Chart.js plugin for live streaming data
chartjs-plugin-streaming 2.x requires Chart.js 3.0.0 or later. If you need Chart.js 2.x support, use the following versions.
- For Chart.js 2.9.x, 2.8.x or 2.7.x, use version 1.9.0 (tutorials and samples)
- For Chart.js 2.6.x, use version 1.2.0
Documentation
Development
You first need to install node dependencies (requires Node.js):
npm installThe following commands will then be available from the repository root:
npm run build # build dist filesnpm run build:dev # build and watch for changesnpm run lint # perform code lintingnpm run package # create an archive with dist filesnpm run docs # generate documentation (`dist/docs`)npm run docs:dev # generate documentation and watch for changesLicense
chartjs-plugin-streaming is available under the MIT license.
Original Link: https://dev.to/barakplasma/showdev-serverless-iot-dashboard-2h92
Dev To
More About this Source Visit Dev To