
An Interest In:
Web News this Week
- April 20, 2024
- April 19, 2024
- April 18, 2024
- April 17, 2024
- April 16, 2024
- April 15, 2024
- April 14, 2024
Some of Our Sources
- Slashdot
- Mashable
- TutsPlus - Code
- Inspiredology
- FanExtra - PSD
- My Ink Blog
- Reencoded
- Spyre Studios
- Freelance Switch
- Web Resource Source
Help Webnuz
Referal links:
Jaeger vs Zipkin - Key architecture components, differences and alternatives
Distributed tracing is becoming a critical component of any application's performance monitoring stack. However, setting it up in-house is an arduous task, and that's why many companies prefer outside tools. Jaeger and Zipkin are two popular open-source projects used for end-to-end distributed tracing. Let us explore their key differences in this article.
Both Zipkin and Jaeger are popular open-source distributed tracing tools. Zipkin was originally inspired by Google's Dapper and was developed by Twitter. Zipkin is a much older project than Jaeger and was first released as an open-source project in 2012. Jaeger was originally built by teams at Uber and then open-sourced in 2015. It got accepted as a Cloud Native incubation project in 2017 and graduated in 2019.
Before we dive into the differences between Jaeger and Zipkin, let's take a short detour to understand distributed tracing.
What is distributed tracing?
In the world of microservices, a user request travels through hundreds of services before serving a user what they need. To make a business scalable, engineering teams are responsible for particular services with no insight into how the system performs as a whole. And that's where distributed tracing comes into the picture.
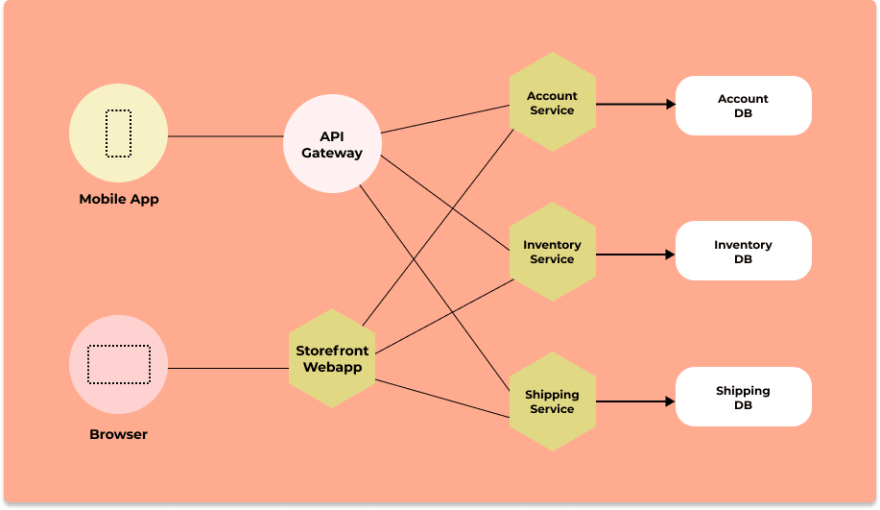 Microservice architecture of a fictional e-commerce application
Distributed tracing gives you insight into how a particular service is performing as part of the whole in a distributed software system. There are two important concepts involved in distributed tracing: Spans and trace context.
User requests are broken down into spans.
What are spans?
Spans represent a single operation within a trace. Thus, it represents work done by a single service which can be broken down further depending on the use case.
A trace context is passed along when requests travel between services, which tracks a user request across services. You can see how a user request performs across services and identify what exactly needs your attention without manually shifting through multiple dashboards.
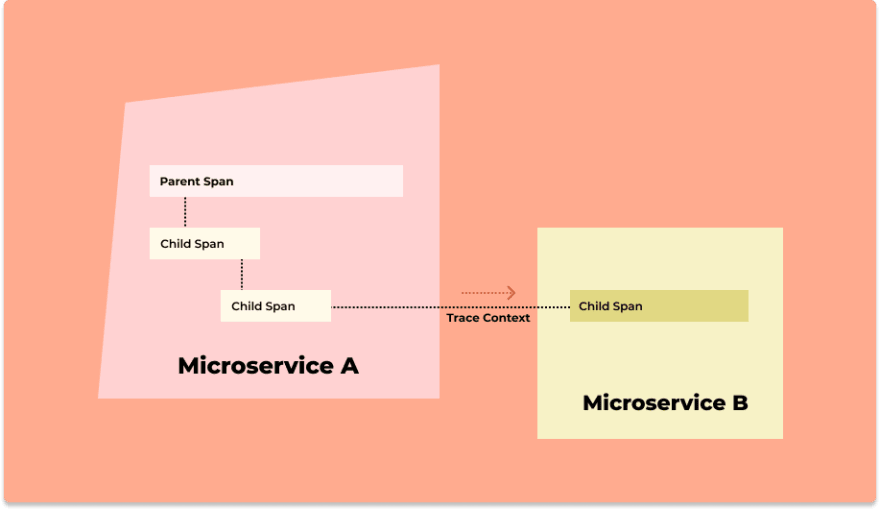 A trace context is passed when user requests pass from one service to another
Jaeger and Zipkin: Key components
Jaeger's source code is primarily written in Go, while Zipkin's source code is primarily written in Java. The architecture of Jaeger and Zipkin is somewhat similar. Major components in both architectures include:
- Instrumentation Libraries
- Collectors
- Query Service and web UI
- Database Storage
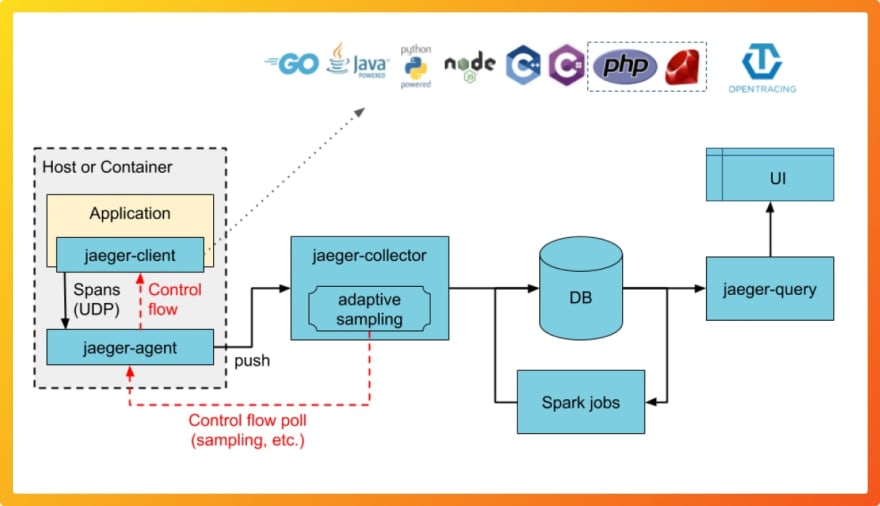 Illustration of Jaeger architecture (Source: Jaeger website)
 Illustration of Zipkin architecture (Source: Zipkin website)
Instrumentation Libraries
Instrumentation is the process of generating telemetry data(logs, metrics, and traces) from an application code. Both Jaeger and Zipkin provide language-specific instrumentation libraries. Instrumentation enables a service to create spans on incoming requests and to attach context information on outgoing requests.
Key points to note about instrumentation libraries of Jaeger and Zipkin:
Jaeger's instrumentation libraries are based on OpenTracing APIs. OpenTracing was also started at Uber with an aim to create vendor-neutral instrumentation APIs for distributed tracing. Zipkin has its own instrumentation libraries.
Jaeger has official client libraries in Go, Java, Node.js, Python, C++, C#. Zipkin team maintains instrumentation libraries for frameworks in C#, Go, Java, Javascript, Ruby, Scala, and PHP.
Both Jaeger and Zipkin support out-of-box instrumentation for a lot of popular frameworks. Jaeger is also compatible with Zipkin's API. That means you can use instrumentation libraries of Zipkin with Jaeger.
Jaeger's 3rd party supported frameworks
Zipkin's 3rd party supported frameworks
Collectors
Telemetry data collected by the instrumentation libraries are sent to a collector in both Jaeger and Zipkin. Jaeger's collectors validate traces, index them, perform any transformations, and finally stores them. Zipkin collector too validates and indexes the collected trace data for lookups.
Query Service and Web UI
Zipkin provides a JSON API for finding and retrieving traces. Jaeger provides stateless service API endpoints which are typically run behind a load balancer, such as NGINX.
The consumer of the query service is a Web UI in both Jaeger and Zipkin, which is used to visualize trace data by a user.
 Jaeger's Web UI showing spans with Gantt charts
 Zipkin's trace UI
Database storage
Both Jaeger and Zipkin provide pluggable storage backends for trace data. Cassandra and Elasticsearch are the primarily supported storage backends by Jaeger.
Zipkin was originally built to store data in Cassandra, but it later started supporting Elasticsearch and MySQL too.
Comparing Jaeger and Zipkin
Jaeger and Zipkin have a lot of similarities in their architecture. Though Zipkin is an older project, Jaeger has a more modern and scalable design. Let us summarize the key differences between Jaeger and Zipkin in the following points:
Jaeger's has wider support of instrumentation libraries as it supports OpenTracing APIs and is also compatible with Zipkin's API. Jaeger also provides an option to migrate from Zipkin.
Jaeger can be deployed as a single binary where all Jaeger backend components run as a single process or as a scalable distributed system. Zipkin, on the other hand, can only be run as a single binary that includes the collector, storage, query service, and web UI.
As Jaeger comes under CNCF along with other projects such as Kubernetes, there are official orchestration templates for running Jaeger with Kubernetes and OpenShift. Zipkin provides three options to build and start an instance of Zipkin: using Java, Docker, or running from the source.
Despite being older, Jaeger has caught up to Zipkin in terms of community support. Zipkin is a standalone project which came into existence before containerization went mainstream. Jaeger, as part of CNCF, is a recognized project in cloud-native architectures.
Both Jaeger and Zipkin are strong contenders when it comes to a distributed tracing tool. But are traces enough to solve all performance issues of a modern distributed application? The answer is no. You also need metrics and a way to correlate metrics with traces with a single dashboard. Most SaaS vendors provide both metrics and traces under a single pane of glass. But the beauty of Jaeger and Zipkin is that they are open-source. What if an open-source solution does both and comes with a great web UI with actionable insights for your engineering teams?
That's where SigNoz comes into the picture.
A better to alternative to Jaeger and Zipkin - SigNoz
SigNoz is a full-stack open-source application performance monitoring and observability tool which can be used in place of Jaeger and Zipkin. It provides advanced distributed tracing capabilities along with metrics under a single dashboard.
SigNoz is built to support OpenTelemetry natively. It also provides users flexibility in terms of storage. You can choose between ClickHouse or Kafka + Druid as your backend storage while installing SigNoz.
 Architecture of SigNoz with ClickHouse as storage backend and OpenTelemetry for code instrumentatiion
SigNoz comes with out of box visualization of things like RED metrics.
 SigNoz UI showing application overview metrics like RPS, 50th/90th/99th Percentile latencies, and Error Rate
You can also use flamegraphs to visualize spans from your trace data. All of this comes out of the box with SigNoz.
 Flamegraphs showing exact duration taken by each spans - a concept of distributed tracing
Some of the things SigNoz can help you track:
- Application overview metrics like RPS, 50th/90th/99th Percentile latencies, and Error Rate
- Slowest endpoints in your application
- See exact request trace to figure out issues in downstream services, slow DB queries, call to 3rd party services like payment gateways, etc
- Filter traces by service name, operation, latency, error, tags/annotations.
- Run aggregates on trace data
- Unified UI for both metrics and traces
You can check out SigNoz's GitHub repo here
Original Link: https://dev.to/signoz/jaeger-vs-zipkin-key-architecture-components-differences-and-alternatives-8b0
Dev To
More About this Source Visit Dev To