
An Interest In:
Web News this Week
- April 20, 2024
- April 19, 2024
- April 18, 2024
- April 17, 2024
- April 16, 2024
- April 15, 2024
- April 14, 2024
Some of Our Sources
- The Logo Smith
- You The Designer
- My Ink Blog
- Line 25
- CSS Tricks
- Codrops
- Willems Lab
- Daily Now
- Dev To
- Hashedout
Help Webnuz
Referal links:
OpenTelemetry vs Prometheus - differences, use-cases and alternatives
OpenTelemetry and Prometheus are both open-source projects under Cloud Native Computing Foundation. In this article, let us understand the key differences between the two projects and explore their advantages and shortcomings.
OpenTelemetry is a vendor-agnostic instrumentation library. It provides a set of tools, APIs, and SDKs to create and manage telemetry data(logs, metrics, and traces).
Prometheus is a time-series metrics monitoring tool. Prometheus enables you to capture time-series data as metrics. These metrics can be aggregated to give insights into the behavior of your systems.
What is OpenTelemetry?
OpenTelemetry is a set of API, SDKs, libraries, and integrations that is aiming to standardize the generation, collection, and management of telemetry data(logs, metrics, and traces). OpenTelemetry is a Cloud Native Computing Foundation project created after the merger of OpenCensus(from Google) and OpenTracing(from Uber).
The data you collect with OpenTelemetry is vendor-agnostic and can be exported in many formats. Telemetry data has become critical to observe the state of distributed systems. With microservices and polyglot architectures, there was a need to have a global standard. OpenTelemetry aims to fill that space and is doing a great job at it thus far.
 OpenTelemetry architecture - client libraries instrument application code to send telemetry data to a collector agent which then exports the data to a backend analysis tool.
Advantages of OpenTelemetry
OpenTelemetry is quietly becoming the world-standard for generating telemetry data. Observability has become a critical component to gauge the health of distributed systems. And telemetry data powers observability. OpenTelemetry removes the need to depend on multiple vendors for generating telemetry data.
Some of the key advantages of using OpenTelemetry are:
- Reduces performance overhead on your application to generate and manage telemetry data
- Supports multiple popular programming languages like Java, Javascript, C++, Go, Python, etc.
- Provides libraries and agents to auto-instrument popular libraries and frameworks requiring minimal changes to your codebase
- Provides OpenTelemetry Collector, which can receive, process, and export data in multiple formats
- Backed by technology giants like Google, Microsoft, and other big cloud vendors.
- Freedom to switch to new backend analysis tools by using relevant exporters
Disadvantages of OpenTelemetry
Some of the key disadvantages of using OpenTelemetry are:
- Project is not mature in some languages
- It does not provide backend storage and a visualization layer
But OpenTelemetry project is intentional about not providing a backend analysis tool as it aims to be vendor-neutral. You can use a tool likeSigNozto send your telemetry data.SigNozis a full-stack open-source application monitoring and observability platform which comes with a great out of box visualization layer. It is also an open-source project.
What is Prometheus?
Prometheus is used as a metrics monitoring tool. It was initially developed at SoundCloud in 2012 before being released as an open-source project. It got accepted into the CloudNative Computing Foundation in 2016 and was the second project to graduate from the foundation, following Kubernetes.
Prometheus is a good tool for monitoring any kind of time-series data. By time-series data, we mean metrics that change over time. For example, requests per second on an endpoint.
Key features of Prometheus
Some of the key features of Prometheus are:
- multi-dimensional data model
- a query language called PromQL to query the metrics data collected
- pull model data collection over HTTP
- an alert manager to handle alerts
- Basic visualization layer but can be combined with Grafana to create rich visualizations
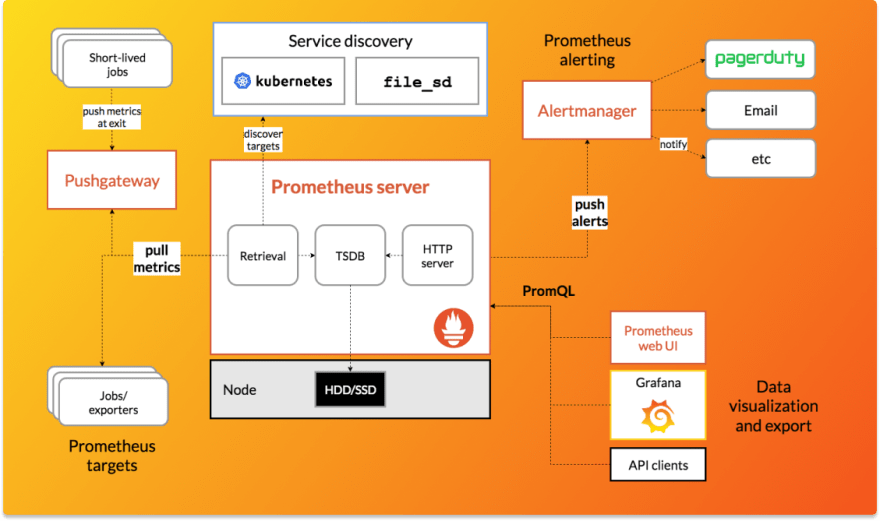 Architecture of Prometheus (Source: Prometheus website)
Disadvantages of Prometheus
Prometheus is a great metrics monitoring tool, but that's it. It is not a full-stack application monitoring tool likeSigNoz. Some of the disadvantages of using Prometheus are listed down below:
- Prometheus only captures metrics. For creating a robust monitoring framework, you will need to track metrics, logs, and traces. For example, a tool like SigNoz captures both metrics and traces(log management in product roadmap).
- Prometheus is designed for a single machine. It cannot be scaled horizontally.
- It takes time and effort to set up Prometheus for a great visualization. It involves setting up exporters and Grafana panels.
- Prometheus does not support root cause analysis as it does not support traces.
Key differences between OpenTelemetry and Prometheus
From the above description, you might have a good idea about the differences between OpenTelemetry and Prometheus. Let us summarize the key differences between OpenTelemetry and Prometheus below:
- OpenTelemetry helps you to instrument code to generate telemetry data. In comparison, Prometheus is a metrics monitoring tool. Both Prometheus and OpenTelemetry provide client libraries to instrument your code, but OpenTelemetry client libraries provide a one-stop solution to generate logs, metrics, and traces. Prometheus can only generate metrics.
- Prometheus comes with a visualization layer, although basic. OpenTelemetry does not aim to provide a visualization layer, and the data collected with OpenTelemetry can be sent to any backend analysis tool like SigNoz.
- OpenTelemetry provides the fundamental layer to build your observability practices, which is now critical for microservices-based architecture. If you use Prometheus in your observability stack, you will have to select other tools for traces and logs.
- Prometheus provides short-term storage, and users can use solutions like Cortex or Thanos for long-term data storage. OpenTelemetry does not provide any storage solution. It provides exporters who can be configured to send data to the backend analysis tool of your choice.
OpenTelemetry and SigNoz - the combo fit to replace Prometheus
With Prometheus, you can monitor metrics. But your engineering teams will never be able to identify the root cause of issues in your application using just metrics. For that, you need distributed tracing.
OpenTelemetry is becoming the world standard for instrumenting application code due to its multi-language support and ease of use. But OpenTelemetry helps only to generate and collect telemetry data. You need to export the telemetry data to a backend analysis tool so that your teams can store, query, and visualize the collected data.
And that's where SigNoz comes into the picture. SigNoz uses OpenTelemetry natively to instrument application codes. OpenTelemetry collector then sends the data to the SigNoz backend, where users have the option to choose between ClickHouse or Kafka+Druid as a storage option.
SigNoz comes with out of box visualization of things like RED metrics. There is a unified UI of metrics and traces, unlike Prometheus, so that you can easily identify the root cause of issues causing things like latency in your apps.
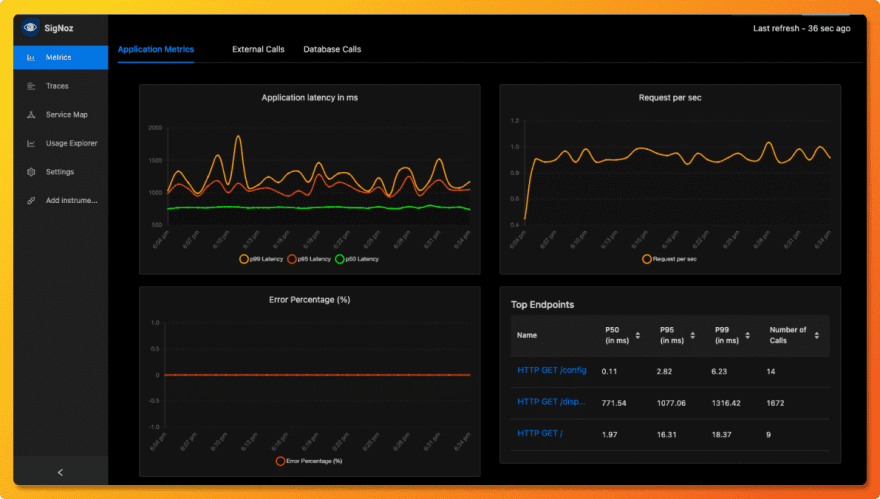 Measure things like application latency, requests per sec, error percentage and see your top endpoints
You can check out SigNoz's GitHub repo here
Original Link: https://dev.to/signoz/opentelemetry-vs-prometheus-differences-use-cases-and-alternatives-5ebd
Dev To
More About this Source Visit Dev To