
An Interest In:
Web News this Week
- April 1, 2024
- March 31, 2024
- March 30, 2024
- March 29, 2024
- March 28, 2024
- March 27, 2024
- March 26, 2024
Some of Our Sources
- Simplebits
- Web Designer Wall
- Smashing Magazine
- Abduzeedo
- My Ink Blog
- Reencoded
- Web Resource Source
- Codrops
- Willems Lab
- TechPowerUp
Help Webnuz
Referal links:
Product developers guide to getting started with AI Part 1: Introduction to dataframes
TLDR
When working with AI, its important to know how to import data sets, read through tables, and understand what the structure is.
Outline
- Introduction
- Before we begin
- Downloading Prerequisites
- My first Dataframe
- Reading Metadata
- Viewing Data
- Data Analysis
- Conclusion
Introduction
Welcome to the Product developers guide to getting started with AI. In this series, well go over key concepts and run through examples using Pandas. First, we will cover setting up your development environment and learning how to inspect your data. Then, youll be ready to tackle the more exciting parts of AI throughout this series.
Before we begin
For the most part, Google Collab has everything already installed except the dataset, skip to My First Dataframe. However, if you want to run it locally then follow the next step. Well be using:
- Python
- Pandas
- NumPy
Downloading Prerequisites (Optional)
When getting started with AI, 2 important libraries youll be using every day are Pandas and Numpy. Follow the link here for instructions to install Python, Pandas, NumPy, and access to Google Collab.
My First Dataframe
First, well begin by going through how to upload files and download our first data set, the Titanic, hosted by the Pandas community on Github.
Open up Google Collab and click on the new notebook button.
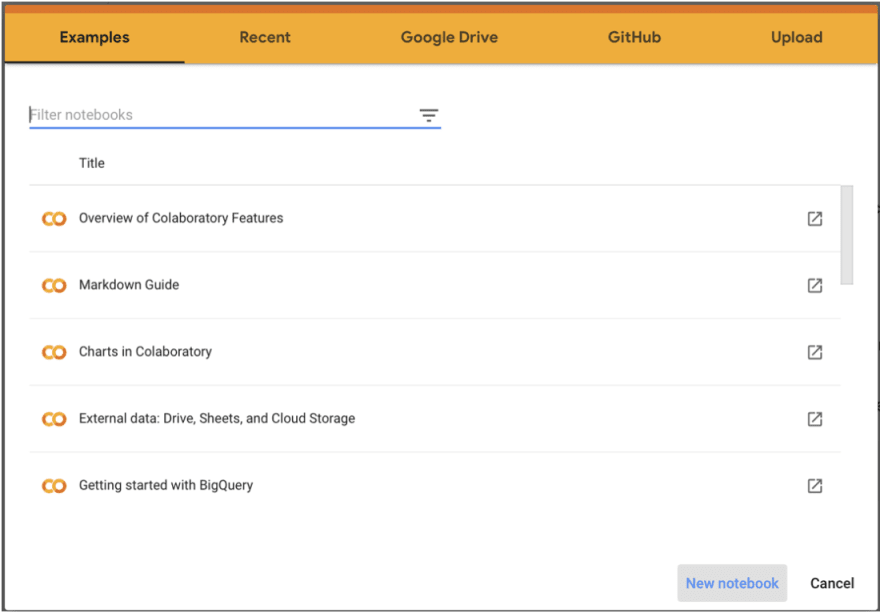 Click on New notebook
Next, well begin by importing titanic.csv to create your first dataframe. Go to the file tab, and click on the file with the arrow to upload from your computer.
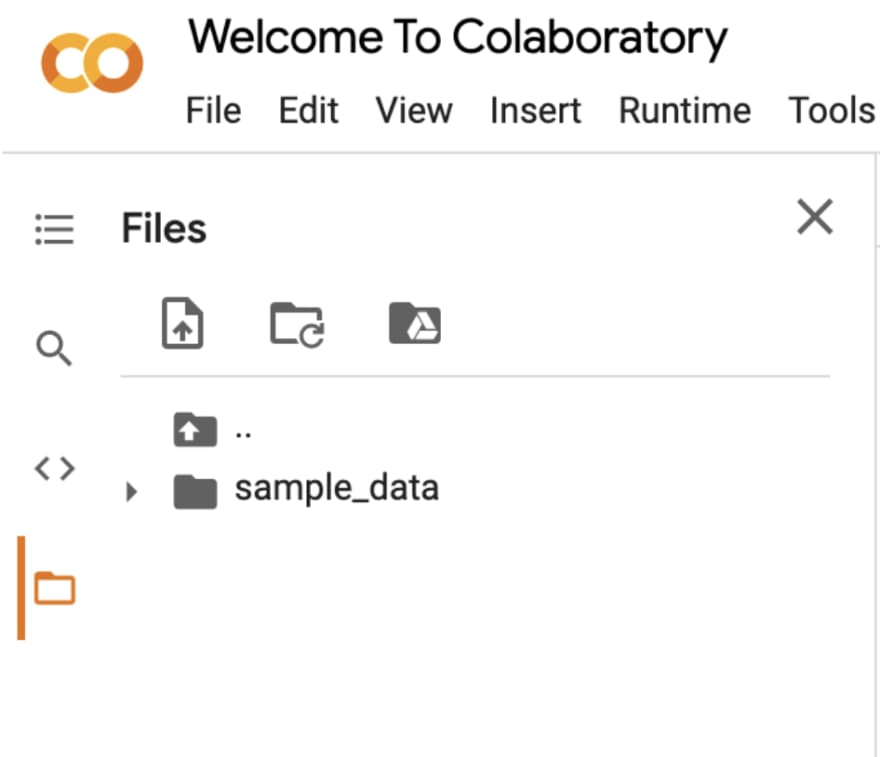 Click on the file with the arrow icon to import titanic.csv
Then import Pandas, Numpy, and use read_csv to extract our CSV data into a dataframe.
 At the beginning, import the libraries and file via code
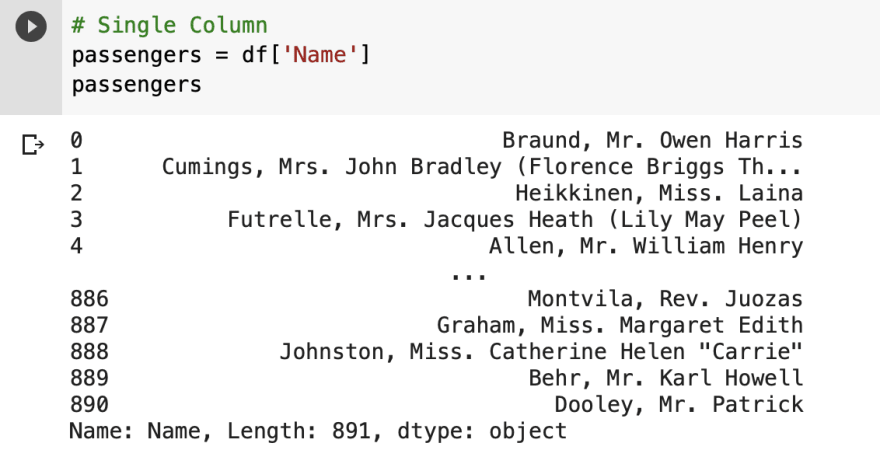
Type the name of the dataframe to view it. Here we call it df, so in the next cell we type df. To run the cell use Shift+Enter or click the run icon at the left.
 Display entire dataframe
Reading Metadata
Unlike a table, a dataframe has some extra data behind the scenes, called metadata. Metadata is used to organize its structure and can be viewed in Pandas by using the describe, info, and columns method. Lets say we wanted to know how many rows and columns contain non-empty values or how much storage the data takes up.

Info is a great method that product developers who have worked with SQL will find similar to the EXPLAIN command. It tells us valuable information about the storage space used, column information, number of rows, indices, and types. All while organizing it into an easy-to-read table.
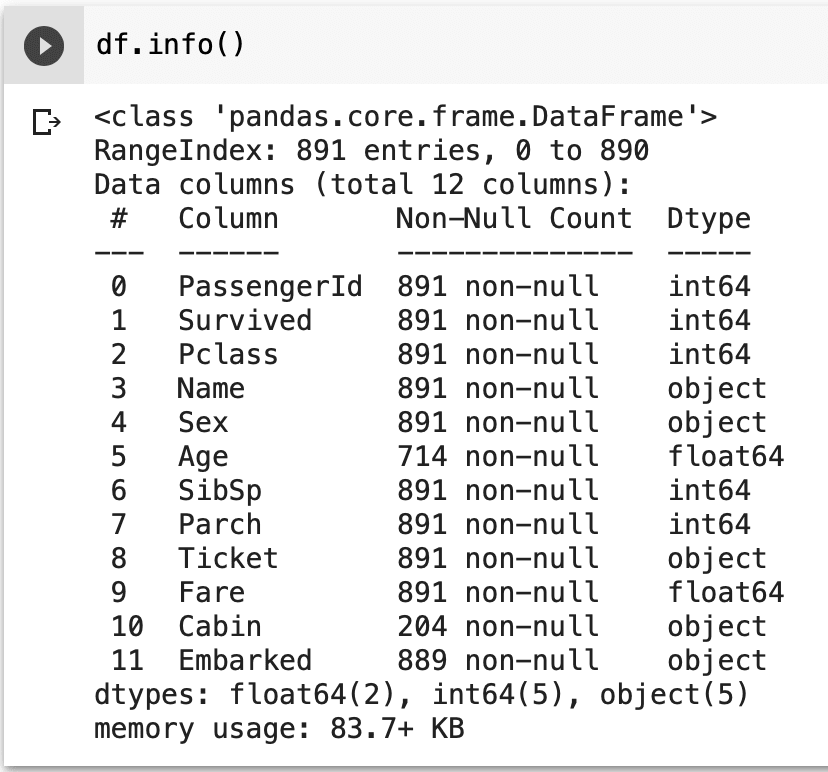 Show all information about the dataframe
Describe is a method best used to summarize the numerical data by calculating a quick mathematical summary and displaying the count, mean, min, max, standard deviation, and percentiles.
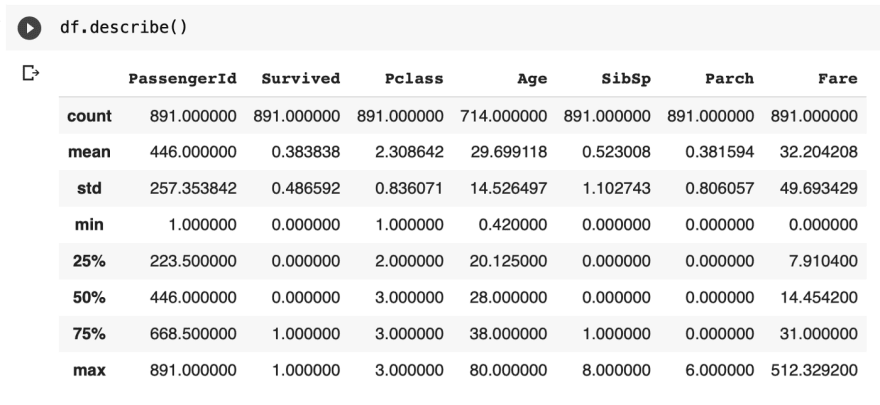 Default output of describe
This is by default equivalent to df.describe(include=[np.number])
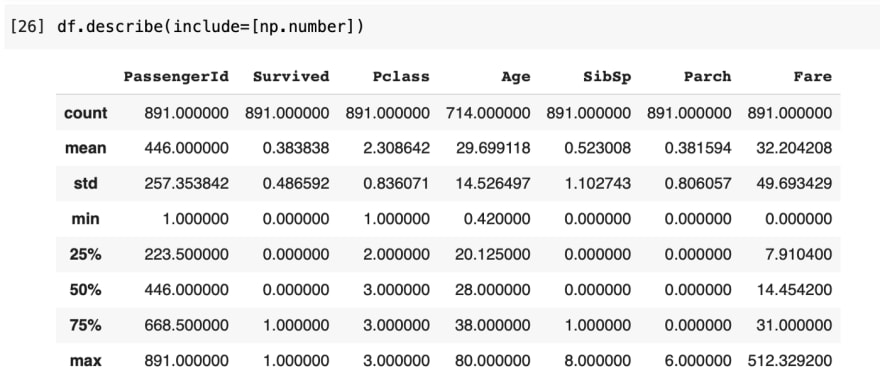 Describe all numbers
By adding the object keyword, describe looks for the unique, top, and frequency of the data for object data, such as strings and timestamps instead. Here, it selects the columns that have a data type of object from the output.
 Describe all objects
Conversely, you may also use exclude instead of include to get the reverse outputs.
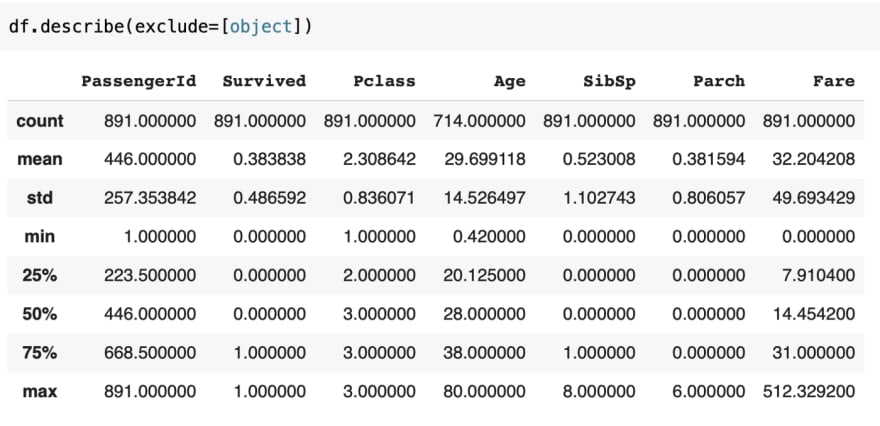 Describe everything that is not an object
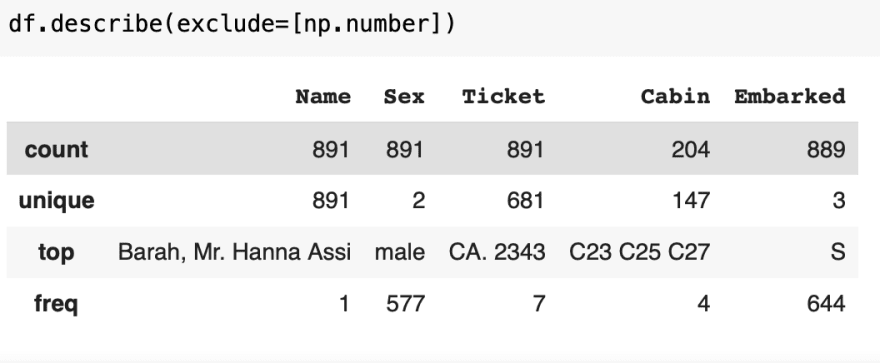 Describe everything that is not a number
But, columns is an interesting method that is used to read metadata and select data. To get the metadata of a column, call it on a dataframe to get the index names.
 Display all index names
There are two ways to select a column, using either the index position or index name. The index position can be found from the metadata of info on the left.
 Access by index position
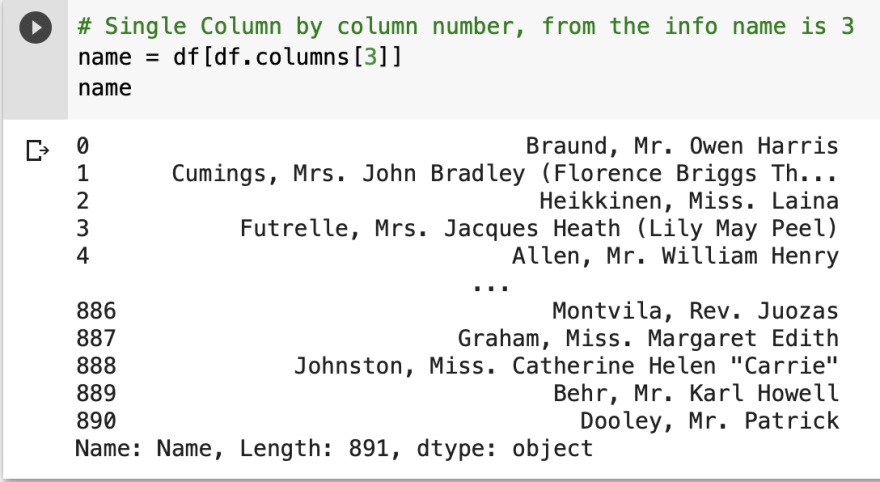
The index name can be found from the output of columns.
 Access by index name
Viewing Data
But most of the time, especially when working with AI, youll have very large datasets and it may not be feasible or necessary to display everything. Dataframes have other features to view parts of the data, by using the head, tail, loc, and iloc method.
 Time to use Python to chop down the data
Lets take a look using indexing with the head or tail method.
To view the data on the first 5 rows, we use head(5)
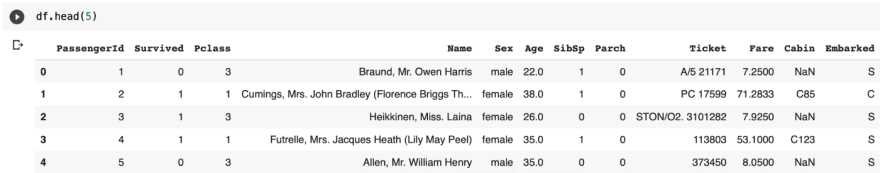 Head refers to the start of the dataframe
Then, to view the data for the last 5 rows, we use tail(5)
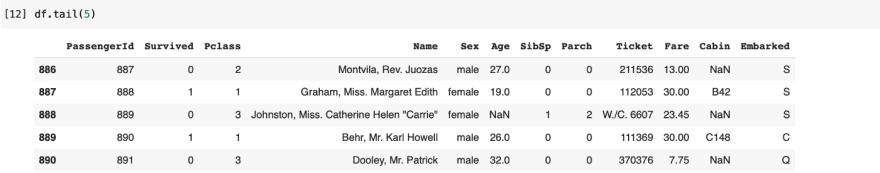 Tail refers to the end of the dataframe
We can view multiple columns using loc, specifying the row index found on the left of the dataframe, along with the names of the columns to view. Since our row index is unlabeled, we use integers to quickly access them. The : command is to set a range of values, to include everything.
 View each Name, Ticket, and Fare
Similarly to loc, you can also use the index position with the iloc command instead.
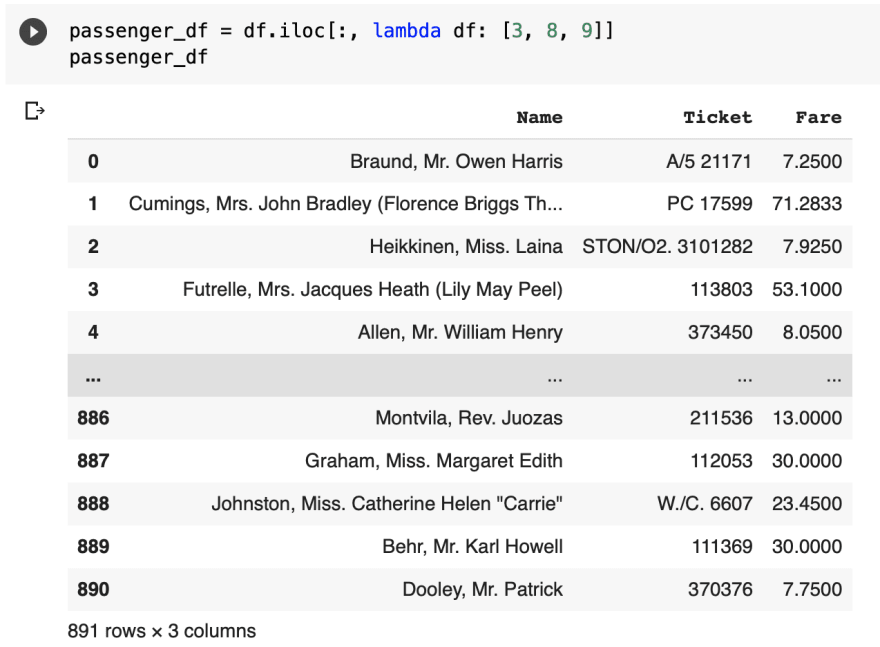 Name, Ticket, and Fare are 3, 8, and 9 respectively
Data Analysis
Combining what weve learned, lets answer common data analysis questions about the Titanic dataset that data scientists and marketing ask themselves every day.
How many people were aboard the Titanic when it sank?
- From info, we see that 889 people embarked on the shipHow much did the average passenger pay?
- From describe, the mean fare was $32What was the standard deviation or std between ticket prices?
- From describe, std of the fare is $50What was the highest cost for a ticket?
- From describe, the max fare is $512Who was the first person to pay for a ticket?
- Using the head on the name column, Mr. Owen Harris BraundWho was the last person to pay for a ticket?
- Using the tail on the name column, Mr. Patrick DooleyWho was the 100th person to purchase a ticket?
- Using iloc for row 99 of column[3], since position starts from 0, Mr. Sinai Kantor
Conclusion
That covers the info, describe, and columns functions for reading metadata and head, tail, loc, and iloc for viewing dataframes. Check back next week for our next guide, Surfing through dataframes, where well be taking a look at how to search through our imported data by grouping, ordering, and rearranging the dataframes structure.
Original Link: https://dev.to/mage_ai/product-developers-guide-to-getting-started-with-ai-part-1-introduction-to-dataframes-20pg
Dev To
More About this Source Visit Dev To