
An Interest In:
Web News this Week
- April 1, 2024
- March 31, 2024
- March 30, 2024
- March 29, 2024
- March 28, 2024
- March 27, 2024
- March 26, 2024
Some of Our Sources
- Engadget
- Creative Curio
- FanExtra - PSD
- Fudge Graphics
- Web Design Ledger
- CSS Globe
- Stylized Web
- CSS Tricks
- Spyre Studios
- Dev To
Help Webnuz
Referal links:
How to Debug PHP Using Xdebug On Vscode
Introduction
It's important to keep a few things in mind while developing web apps.
When it comes to building large and powerful applications, a competent developer will always follow best practices. Testing, debugging, performance, and security of websites or apps are some of these techniques.
Using VSCode and the PHP xDebug module, you'll enable full-featured functional debugging throughout your whole application.
Prerequisites
The following criteria must be met in order to follow along with this guide:
- A PHP development environment that runs at least PHP 7.0.
- An appropriate version of Visual Studio Code for your operating system
Step 1 How to Download and Install the XDebug Tool
Real-time debugging is made possible using Xdebug, a PHP extension. On the other hand, it can be useful for troubleshooting server-side problems. Since it shouldn't be active on most requests, Xdebug isn't enabled in the same manner as the other extensions are.You would install it following the steps below:
Windows
Xdebug provides a wizard tool for Windows users to obtain a.dll file. In order to do this, first create a PHP file in a folder, and then add the following code line:
<?php phpinfo();?>Use your browser to launch the index.php file . This will provide the information displayed in the image below.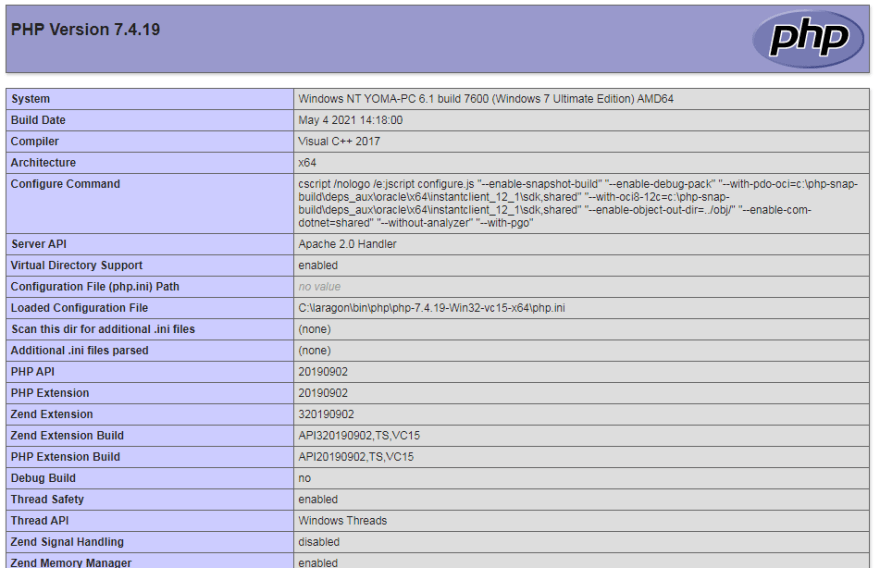
- Select and copy all information on the page.
You'll next need to go to the XDebug Wizard tool and paste the information into a Text Box input field.
Look for 'Analyze my phpinfo() output' and click it.

There is a module that may be downloaded under Instructions, number 1. As you can see in the image below:

Please note that the path to the directory in this example may be different from yours, so please pay attention to the directions in the image above.MAC
You can install PHP7 Xdebug using pecl extension:
pecl install xdebugLinux
On Linux distribution like fedora 32, you can use Sudo to install Xdebug in PHP:
sudo yum install php-xdebugyou can refer to the xdebug docs if you use other linux distribution.
It's time to enable Xdebug by adding the following code to file xdebug.ini under etc/php/7.0/mods-available/
xdebug.profiler_enable_trigger = 1xdebug.profiler_enable = 0xdebug.remote_enable = 1xdebug.profiler_output_dir = "/tmp"Now restart your server.
Step 2 Enabling the XDebug extension in PHP
Microsoft's Visual Studio Code (VS Code) is a free open source text editor. VS Code is available for Windows, Linux, and Mac. There are significant features in the editor that make VS Code one of the most popular programming environments in recent years, despite its size.
Firt
Launch VS Code
Install the Felix Becker PHP Debug extension. The PHP Debug extension may be found in VSCode's Extensions tab by searching for it.

Click on the
Runtab and click on add configuration.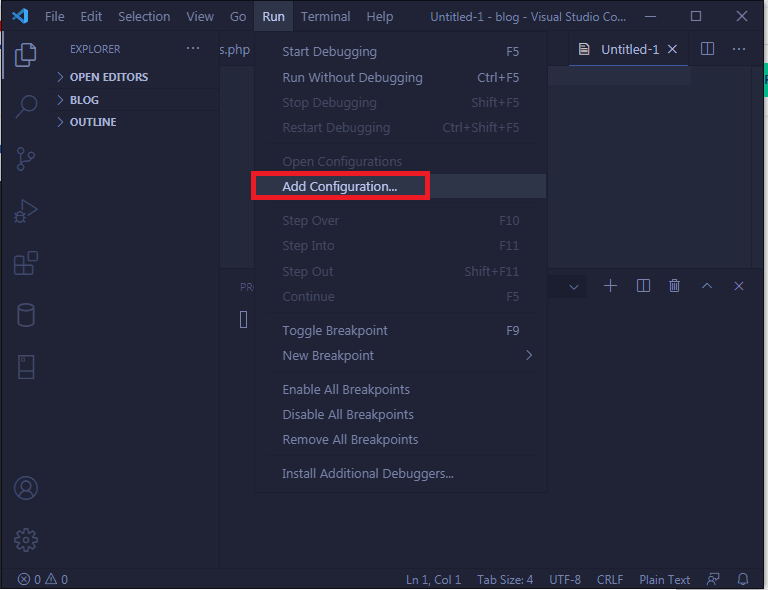
Now, you'll need to pick the PHP environment. A newlaunch.jsonfile will be added to the root directory by VSCode.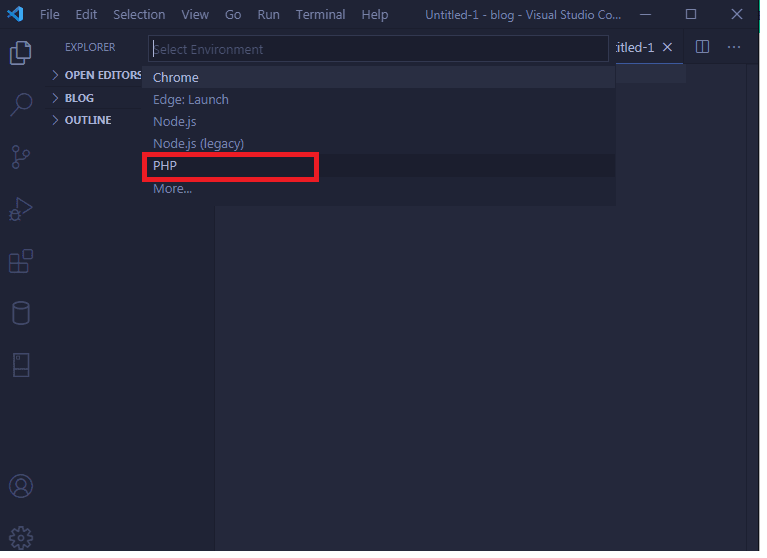
Finally, add theruntimeExecutableproperty to the list after port replacingpath_to_php_executablewith the path to your php executable:
"runtimeExecutable": "path_to_php_executable"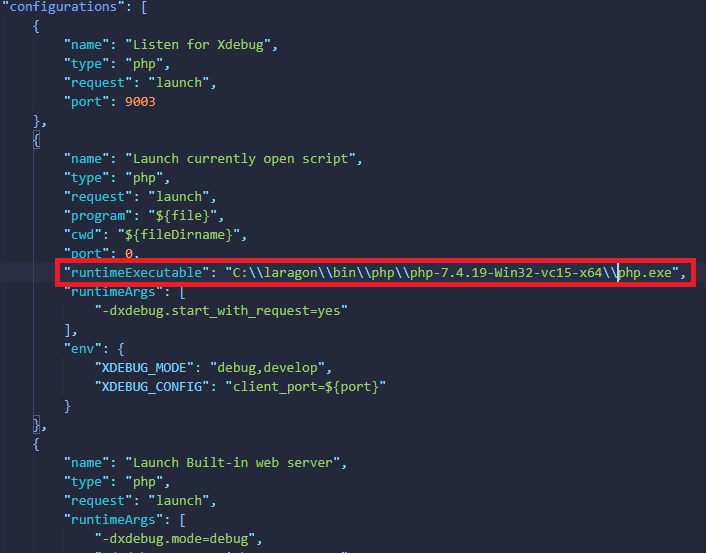
Please save the file launch.json. Start debugging by opening the debug mode tab and clicking the green debug button.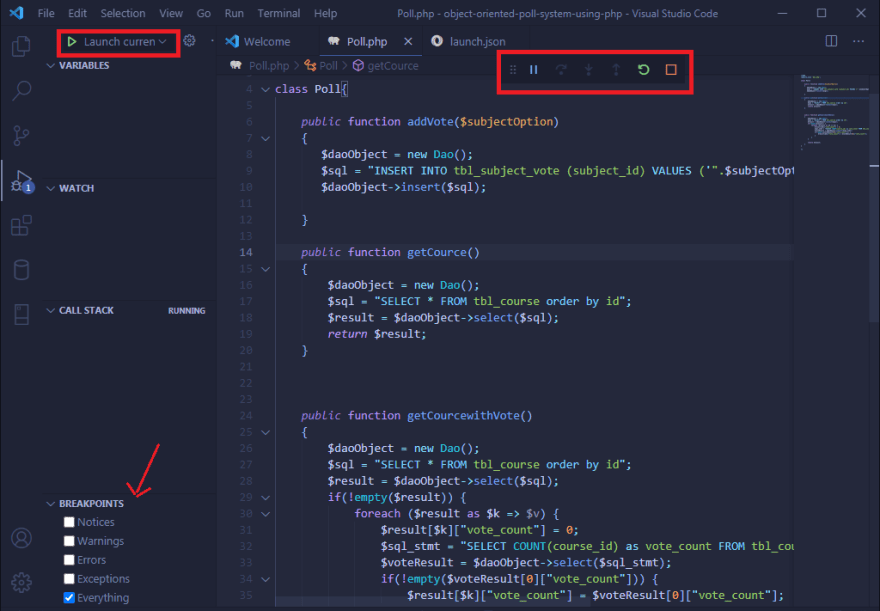
You will now see several options in the window, via which you can pick what logs Xdebugger will show like:
- Notices
- Warnings
- Errors
- Exceptions
- Everything
Access the Debug Console, which displays error information and debug execution buttons at the top.
You have the option to make your selections. What I'm going to tell you now is something I've previously addressed in the early stage breakpoints. A breakpoint on a line of code is now available. It's important to note that Xdebug will display the PHP debug script name and line number in the bottom left area.
In order to debug the application correctly you may launch it in the browser and then go through the code line-by line to spot the issues and fix them. A few shortcut keys for functions and lines of codes should also be remembered:
F5: Continue Debugging
F10: Step Over
F11: Step into
Shift + F11: Step out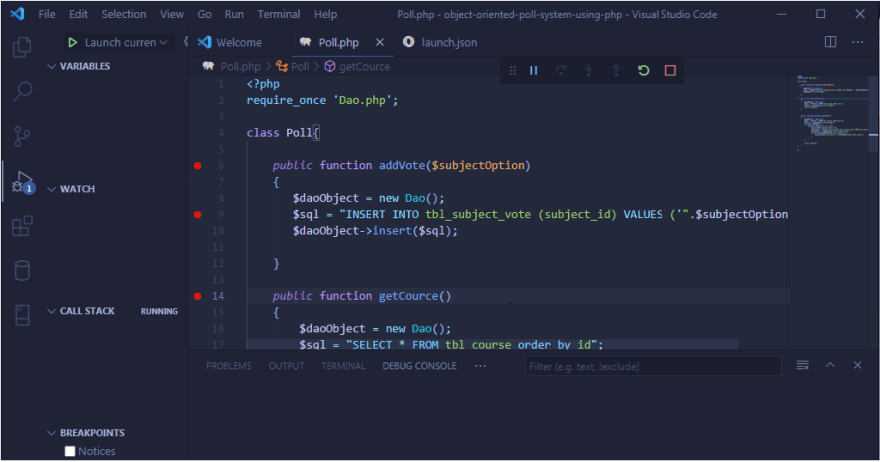
Conclusion
Software development is never complete without debugging.
You can't tell what's wrong with the code without it.
A PHP debugger that identifies problems and warning signals fast is a fantastic idea if you're working on an application with thousands of lines of code and you want to be sure you've set up your debugging environment before you start writing code.
In this article, you learnt how to enable PHP debugging with Xdebug and setup it in VSCode. IDEs like as Eclipse, PHPstorm, and others can also be used to incorporate it.
Original Link: https://dev.to/yongdev/how-to-debug-php-using-xdebug-on-vscode-3n4
Dev To
More About this Source Visit Dev To