
An Interest In:
Web News this Week
- March 30, 2024
- March 29, 2024
- March 28, 2024
- March 27, 2024
- March 26, 2024
- March 25, 2024
- March 24, 2024
Some of Our Sources
- Web Designer Wall
- Team Treehouse
- The Logo Smith
- Spoon Graphics
- Inspiredology
- Web Designer Depot
- Naldz Graphics
- Noupe
- Android Dissected
- Android Headlines
Help Webnuz
Referal links:
Creating a Helm Chart for Grafana
What's Minikube ?
minikube is a tool that lets you run Kubernetes locally. minikube runs a single-node Kubernetes cluster on your personal computer (including Windows, macOS and Linux PCs) so that you can try out Kubernetes, or for daily development work.
Start the Minikube
minikube start --vm-driver=none Our single node cluster is ready to use so run the below command to check the minikube status
minikube status you will get output such as:
C:\Users\Asus_1\minikube statusminikubetype: Control Planehost: Runningkubelet: Runningapiserver: Runningkubeconfig: ConfiguredSetup has been completed...
But before creating it, let's try to understand Helm and Grafana.
What's Grafana ?
Grafana is a multi-platform open source analytics and interactive visualization web application. It provides charts, graphs, and alerts for the web when connected to supported data sources and End users can create complex monitoring dashboards using interactive query builders. Grafana is divided into a front end and back end, written in TypeScript and Go, respectively.
What is Helm?
In simple terms, Helm is a package manager for Kubernetes. Helm is the K8s equivalent of yum or apt. Helm deploys charts, which you can think of as a packaged application. It is a collection of all your versioned, per-configured application resources which can be deployed as one unit. You can then deploy another version of the chart with a different set of configuration.
Helm helps in three key ways:
Improves productivity
Reduces the complexity of deployments of micro services
Enables the adaptation of cloud native applications
Why we need Helms?
Writing and maintaining Kubernetes YAML manifests for all the required Kubernetes objects can be a time-consuming and tedious task. For the simplest of deployments, you would need at least 3 YAML manifests with duplicated and hard-coded values. Helm simplifies this process and creates a single package that can be advertised to your cluster.
What are Charts?
In Kubernetes, we package all the running resources in a zip file known as the chart. A Helm chart can contain any number of Kubernetes objects, all of which are deployed as part of the chart. A Helm chart will usually contain at least a Deployment and a Service, but it can also contain an Ingress, Persistent Volume Claims, or any other Kubernetes object.
Installing Helm
Helm had the client-server architecture till version 2, We have to need to install a server-side program Tiller in the Kubernetes cluster.
In version 3 helm provides more facilities i.e. install helm on the client-side only. It provides more security than version 2. We can install helm in Mac, Windows, and Linux.
The URL where you can download helm according to your operating system. Link
In windows after downloading the helm, we got a zip file,
Extract the zip and go to folder that will come after extracting
Copy the path and add it into the environment variable because in the command line everywhere we can do access helm.
To check the helm installation run the command
helm version you will get output such as:
C:\Users\Asus_1>helm versionversion.BuildInfo{Version:"v3.6.3", GitCommit:"d506314abfb5d21419df8c7e7e68012379db2354", GitTreeState:"clean", GoVersion:"go1.16.5"}After successfully done the installation part, lets create a chart for Grafana.
Create a Helm Chart
let's create a new Helm Chart from the scratch. Helm created a bunch of files for you that are usually important for a production-ready service in Kubernetes. To concentrate on the most important parts, we can remove a lot of the created files. Lets go through the only required files for this example.
Create a Helm Chart for Grafana.
mkdir grafanacd grafana But here we need a project file that is called Chart.yaml and contains all the metadata information.
So, create this file. Also, C should be capital in the Chart.yaml.
For Windows:
notepad Chart.yamlFor Linux:
vim Chart.yaml Write the below code inside Chart.yaml.
apiVersion: v1name: Grafanadescription: A Helm chart to setup Grafanatype: applicationversion: 0.1.0appVersion: 0.1.0 Make a templates folder inside grafana and go inside it.
mkdir templatescd templatesYou can use my image to download Docker image of Grafana.
https://hub.docker.com/repository/docker/surajwarbhe/grafana
Use below command to pull my docker image.
docker push surajwarbhe/grafana:v1 Use this command to create a code of the deployment.yaml file.
kubectl create deployment grafana --image=surajwarbhe/grafana:v1 --dry-run -o yaml > deployment.yaml The output should be similar to the following:
C:\Users\Asus_1\grafanaemplates>kubectl create deployment grafana --image=surajwarbhe/grafana:v1 --dry-run -o yaml > deployment.yamlW0826 09:59:25.756492 1640 helpers.go:535] --dry-run is deprecated and can be replaced with --dry-run=client. Go outside the grafana directory and install the helm chart.
cd helm install grafana grafana/NOTE: Here grafana is the name of Helm Chart and grafana/ is the path of the chart.
After running above command, the output should be similar to the following:
C:\Users\Asus_1>helm install grafana grafana/NAME: grafanaLAST DEPLOYED: Thur Aug 26 10:25:45 2021NAMESPACE: defaultSTATUS: deployedREVISION: 1TEST SUITE: None Now again go inside grafana/templates and use the below command to create a code of the service.yaml file.
cd grafana/templates/kubectl expose deployment grafana --port=3000 --type=NodePort --dry-run -o yaml > service.yaml The output should be similar to the following:
C:\Users\Asus_1\grafanaemplates>kubectl expose deployment grafana --port=3000 --type=NodePort --dry-run -o yaml > service.yamlW0826 10:03:55.911918 6892 helpers.go:535] --dry-run is deprecated and can be replaced with --dry-run=client. After it, run the below command for exposing the grafana pod.
kubectl apply -f service.yaml To ensure your pod is working well with the below commands.
kubectl get podskubectl get deploymentkubectl get svc After running these commands, the output should be similar to the following:

You can check the list of the helm you have using the helm list command. Now we can check the pods in which slaves are running in the Kubernetes cluster.
C:\Users\Asus_1>helm listNAME NAMESPACE REVISION UPDATED STATUS CHART APP VERSIONgrafana default 1 2021-08-25 09:38:04.967518153 -0400 -0400 deployed Grafana-0.1.0 0.1.0 After running the command pick the port number that has been exposed Grafana service. And also run one more command if you run a single node cluster minikube.
minikube ipSo let's check that Grafana is working fine or not. For this, you have to take the minikube_ip and port no. of your pod.
eg. 192.168.99.102:30147
After browsing it, login page will pop up. So login with by-default username and password admin.

After logging you will get the page for changing the username and password, So you can if you want.
Packing resources inside the Helm Chart.
So helm chart ready inside the grafana/ directory, but we cant publish it as it is. Firstly, we have to create a package for this helm chart.
Create one directory named charts. Make sure this directory should be inside grafana directory.
mkdir charts Now, run the following command to packages the chart and store it inside the charts/ directory.
helm package C:\Users\Asus_1\grafana -d charts\ you will get output something like this:
Successfully packaged chart and saved it to: charts/Grafana-0.1.0.tgzCreating an index.yaml file
For every Helm repository, we must require an index.yaml file. The index.yaml file contains the information about the chart that is present inside the current repository/directory.
For generating index.yaml file inside charts/ directory, run following command.
helm repo index charts/Pushing the charts in the GitHub repository
Create a new repository in GitHub and upload charts/ source code into the GitHub repository.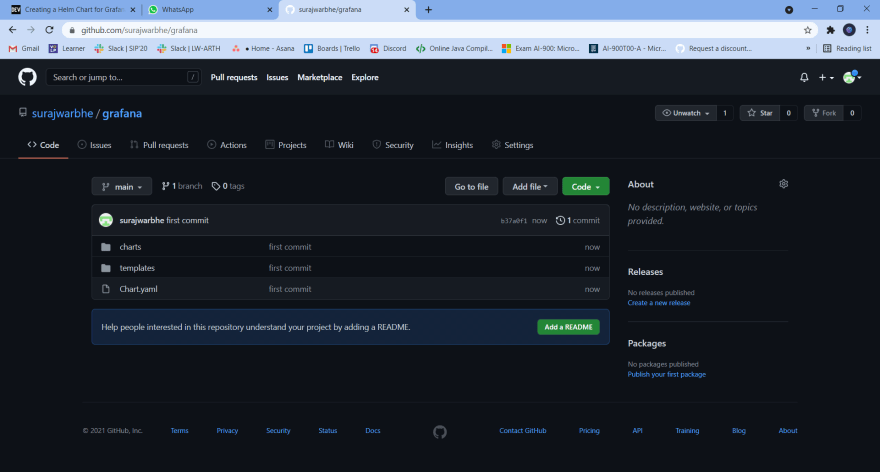
Hosting Chart using Github Pages
We must require a URL where we had hosted our helm chart for publishing the Helm chart on artifacthub.io/. One of the ways to host the charts is using GitHub pages.
So, we will first host our charts using GitHub pages.
Go to the settings of your Github repository and go down where you can see the GitHub Pages section.
Select main as a branch and click on save.

Publishing helm chart on artifact hub
Go to this URL artifacthub.io/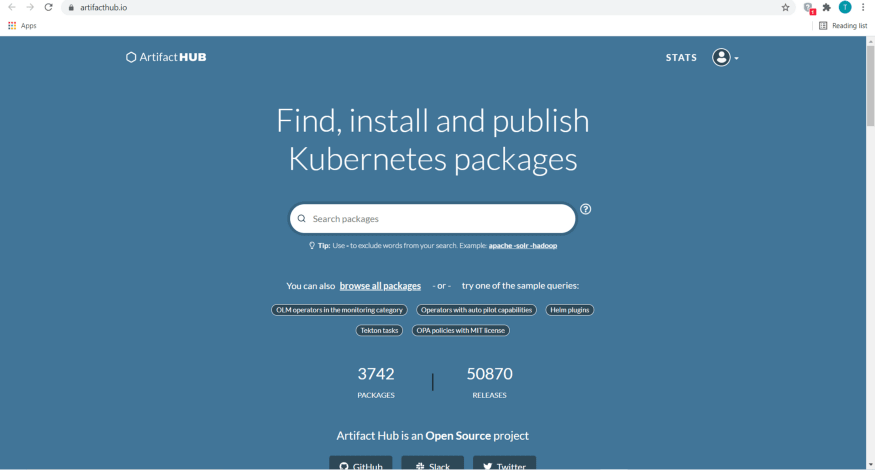
Sign in with your account if you have otherwise you have to need to create an account.
After signed in successfully, In the right top corner click on the face you have seen.
Now click on profile icon > control Panel> Add repository.
NOTE: Make sure your repository's url should be like https://username.github.io/repository_name/chart/ when you're adding repository in ArtifactHub. Otherwise, it can create some issues related to url.
After giving the required information to your Helm repository, click on Add. if you had provided the right information then it will create a Helm repository.
So, we had successfully published our Helm chart to the ArtifactHub.
Conclusion
In this tutorial, you created a helm chart for installing GRAFANA and How to upload our repository on ArtifactHub.
Keep learning keep sharing
Thank You
Original Link: https://dev.to/surajwarbhe/creating-a-helm-chart-for-grafana-3055
Dev To
More About this Source Visit Dev To