
An Interest In:
Web News this Week
- April 1, 2024
- March 31, 2024
- March 30, 2024
- March 29, 2024
- March 28, 2024
- March 27, 2024
- March 26, 2024
Some of Our Sources
- Web Designer Wall
- Team Treehouse
- Joshua Blankenship
- Creative Curio
- Naldz Graphics
- Reencoded
- 24 Ways
- Freelance Switch
- Codrops
- Hashedout
Help Webnuz
Referal links:
Easy Graph Visualization With Motif
Motif is a graph viz web app that simplifies analysis and exploration of rich graph datasets.
Inspired by kepler.gl, it makes visual discovery on graph datasets accessible to analysts, data scientists and managers.
It was created to make analysis and exploration of rich graph datasets with numerous node and edge properties easy. With a web interface, we make it easy to share results and analysis.
In this post, I will highlight the main features of Motif and do a walkthrough showing how we can visualize the Les Misrables dataset!
Feel free to try it out at https://demo.cylynx.io. If you like the project, give us a star at our github repo!
Features
Import options

Motif supports a variety of import options including CSV files (edge lists, or node-and-edge CSVs), JSON files (its native format), Neo4j and it also includes a jupyter notebook integration!
For more information on using Motif with jupyter notebooks, check out our post on pymotif.
Layouts and styling options

A variety of layout options are available including Concentric, Radial, Grid, Sequential, Circular, Force-directed, and fixed coordinates.
You can also customize the colors and size of the nodes, as well as their labels. This includes mapping a particular node attribute to a color which automatically creates a legend! Similar styling options are available for edge properties as well.
Filtering and search options

What's an explorer without filtering and search options? Like
Kepler.gl, we provide a time filtering bar and different filtering options depending on the filtered propertys data type (string, number or date).
Getting started with Motif
Simply head to demo url to get started and try out the various features outlined in the post.
Importing Les Misrables
Let's take a look at how we can visualize the Les Misrables dataset. The Les Misrables dataset is included as a sample data so one can simply click on the "Sample Data" tab highlighted blue in the screenshot below, followed by the Les Misrables box, highlighted in green.

Properties panel and tooltips
We can click on the "Select All" button in the node and edge properties panel to configure the attributes that we would like to see in the tooltips.
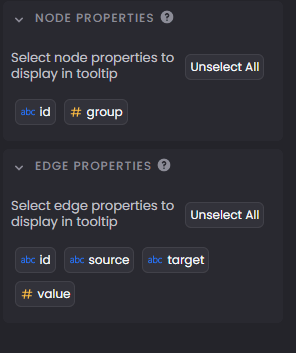
Double clicking a node and edge will show the relevant information in a tooltip.
Configuring styles
The toolbar on the left provides a list of panels which comes in handy in data exploration and analysis. This includes a layers panel, a styles panel, a filter panel and a search panel.
Let's switch from the layers panel to the styles panel by clicking on the palette icon .

Feel free to play around with the numerous styling options available
In the next section, I will show how we can create a pretty looking visualization that looks like this:

Use force-directed layout
Force-directed layout is a good choice and tends to create aesthetically pleasing layouts.
The math behind it is a little complicated and involves simulating the repulsive forces within an electrically charged system. Check out this post for more information.
Within Motif, the logic has been programmed and all that is required is to change the layout dropdown to force-directed!

Add a node label
Next, let's label the nodes with the characters names. In our dataset, the names are stored in the "id" field. Click on the 'label' dropdown box within 'node styles' and select the "id" property.

Color the nodes based on the group field
The nodes have a "group" attribute that was generated by a clustering algorithm. Let's color the nodes based on their grouping.
To do that, we need to change the 'node color' from 'fixed' to 'legend', followed by choosing the "group" attribute as our variable of choice.

Saving your masterpiece
That's it! You should have successfully replicated the example.
To save or take a screenshot of your graph, head back to the layers panel and click on the camera button to take a screenshot, or the save button to download the file in JSON format.

Share the graph via email or slack, and the recipient can simply drag and drop the graph in the import modal to visualize it as you have created!
Conclusion
I hope this post gives you a good introduction to Motif. Would love to see what you can create with the tool as well! If you have any feedback or comments, feel free to leave them here or at our [Github discussions page].(https://github.com/cylynx/motif.gl/discussions)
Related content
pymotif - Motif with jupyter notebook
motif with Neo4j (Nodes 2021, starts at 1:04:07)
Github repo
more information
Original Link: https://dev.to/timlrx/easy-graph-visualization-with-motif-42dh
Dev To
More About this Source Visit Dev To